|
|
|
Geometric constraint model: boundaries to species distribution,
bathymetric ranges, and species diversity depth-gradients
This lab is interested in the
distribution of bathymetric ranges
of benthic deep-sea taxa and how boundaries to distribution determine
parabolic patterns in deep-sea diversity observed in "real" taxa.
These studies were motivated by a resurgence in interest in how the
geographic ranges in terrestrial taxa correlate with latitudinal trends
in species richness.
Using the distributional ranges of species to attack diversity
problems is, of course, nothing new, and as R. McArthur pointed:
- "The range of single species would seem to be
the basic unit of biogeography. Curiously enough, the history of science
often proceeds in a reverse order from expectations and this is very true
in biogeography. Patterns on islands…, of species diversity…, and of
tropical communities are already clear and even moderately well understood
while patterns of single species' ranges still seem to be catalogs of
special cases."
(p. 127. MacArthur R. H. (1972) Geographical ecology.
Patterns in the distribution of species. Princeton University Press,
Princeton, New Jersey, 269 pp.)
|
|
|
|
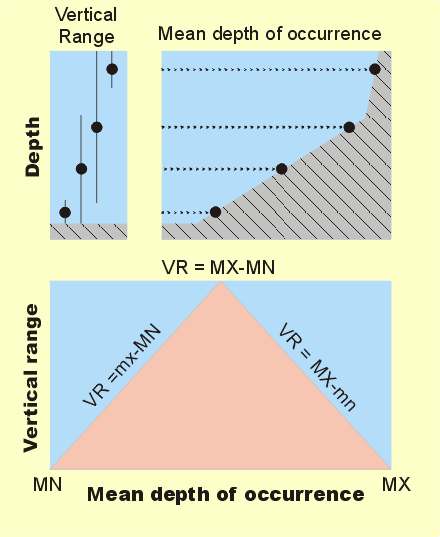
"Schematic representation of the geometric
constraint model. Boundaries are denoted as MN
(seasurface) and MX (deepest region) while mn and mx
represent the minimum and maximum depth of occurrence of a species. Black
circles represent species' mean depth of occurrence. The upper panel shows
species mean depth of occurrence and their vertical range. It is shown how
the vertical range is determined by the proximity of a boundary. The
vertical range is equal to 2 times the distance of the species Md
to the closest barrier. The lower panels are a schematic representation of
the relationship between the VR and Md. The shaded
triangle represents tje constraint envelope for Vr - Md values.
According to the model, VR values outside the triangle are
impossible. Equations provide VR when the range is restricted by a
boundary. The left side of the panel shows the case where the minimum depth
of occurrence is equal to the shallow barrier, mn = MN, while the
right side of the panel describes the case where mx = MX. Thus, a
species with Md close to
MX has a vertical range VR=MX-mn." (Pineda,
1993)
|
|
|
|
|