Using MODIS ocean color satellite
images collected during March -- July 2004, an attempt was made to
observe a series of eddies in the central Sargasso Sea before and
during 2 first cruises of the EDDIES project. Five eddies of interest
were identified prior to the cruises using satellite altimetry: 3
anticyclones and 2 cyclones. Using altimetry archive each of the eddies
was tracked to determine its trajectory and amplitude. Then
this data set together with
cruise data was used to identify exact position and strength of a
particular eddies in color images.
We have used SEADAS software to display MODIS color images processed to
Level 2 chlorophyll-a maps using cylindrical map projection with
the spatial
resolution ~1 km. The chlorophyll levels in each of the eddies did not
remain constant over the time; so, the features are
not clearly evident in each image.
March-April 2004.
During this period, when the mixed layer is deep or just starts to
shoal, and the spring phytoplankton bloom is triggered, satellite
images show increased concentrations of surface chlorophyll.
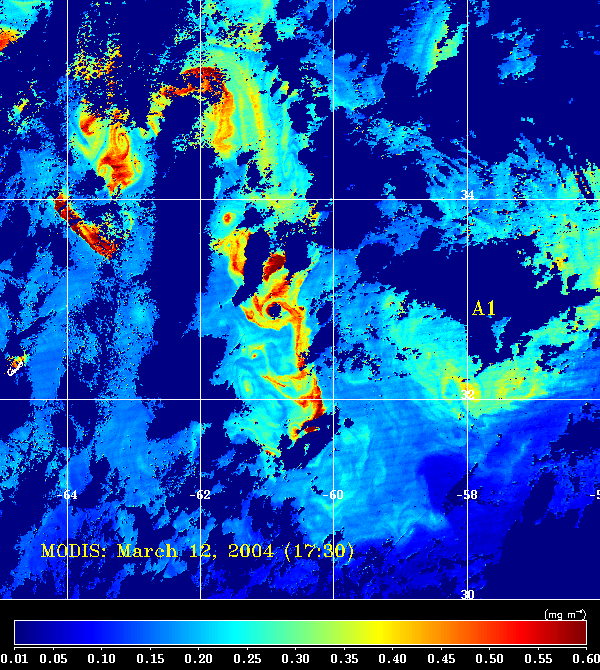
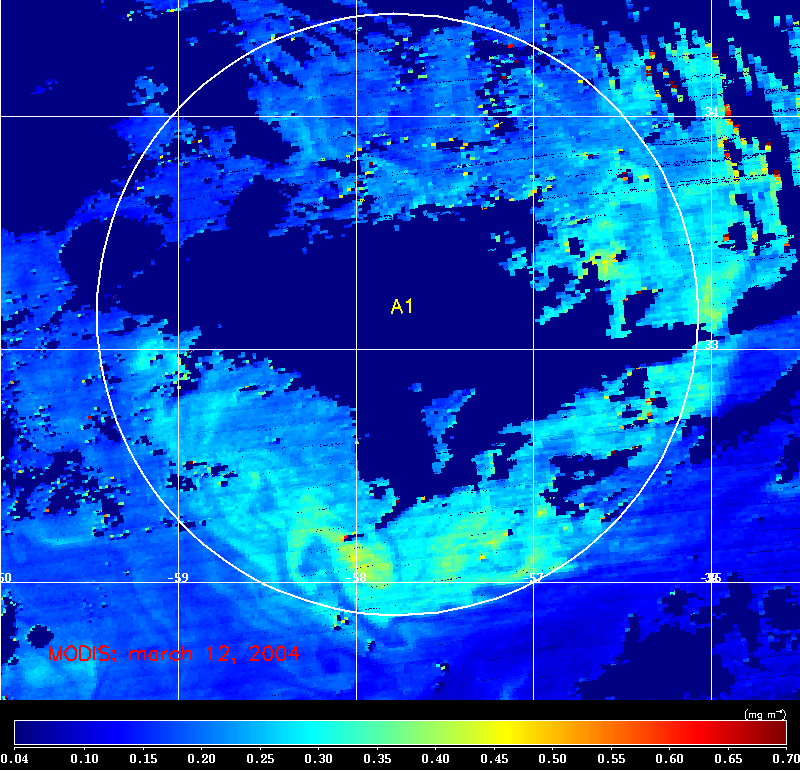
MODIS image acquired March
12, 2004 shows increased Chl-a concentrations tied
with a frontal zone located along 61W with a multiple small-scale
swirls. Anticyclone eddy marked as "A1", in its central part and
north of it is obscured by clouds. But a broad belt of increased Chl-a
concentration is clearly seen in the southern and eastern parts of the
eddy. It is not clear if this increase is associated with the
local upwelling inside the eddy, or
is due to horizontal advection of phytoplankton from the adjacent
cold eddy located NE of "A1". Another one Chl-a patch located at
31N, 60W may be associated with western periphery of cold
eddy "C1". Altimetry maps show that center of this eddy is located at
31.5N, 59W.
Next image acquired 2 weeks
later March 28, shows Chl-a maximum located
SE and S of two patterns associated with 2 strong cold eddied
(rings?). Anticyclonic eddy center marked as "A1", is located
approximately 50 km SE of that feature. At this time, increased
Chl-a concentration is evident in center of cold
eddy marked "C1", and in center of another one cold eddy
marked "C2'. An interesting feature is a tongue of low chl-a
water intruding through the south periphery of C1 from SW. This
tongue has anticyclonic rotation and may be associated with
the anticyclonic eddy A2.
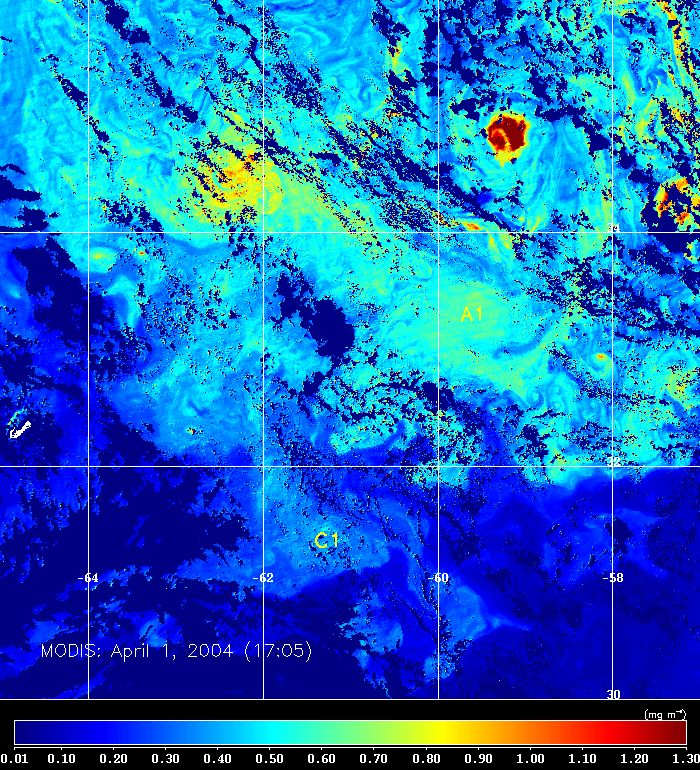
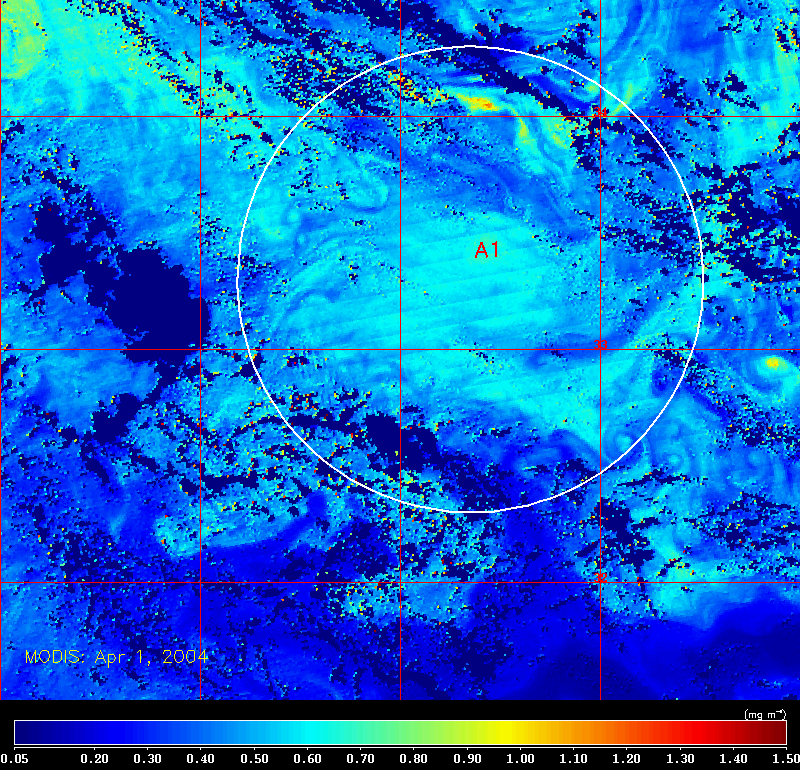
Color image obtained on April 1, 2004, shows Chl-a pattern
consisting of two rings and A1 eddy. But in this case the area of
increased chl-a is located right in the center of "A1" eddy. An
interesting feature is a long "sleeve" connecting eastern parts of A1
and cold core eddy just to the north of A1. Taking into account
direction of rotation in both eddies we can conclude that
A1 eddy advectively transports high chl-a waters and accumulates them
in its central part. But these waters not originated from the adjacent
cold eddy. Seem, both of them transport high chl-a waters which are
resulted from the upwelling processes on the periphery
of these eddies. In lower part of the image a low chl-a tongue
has moved further to the east and the remnant of eddy "C1" is evident.
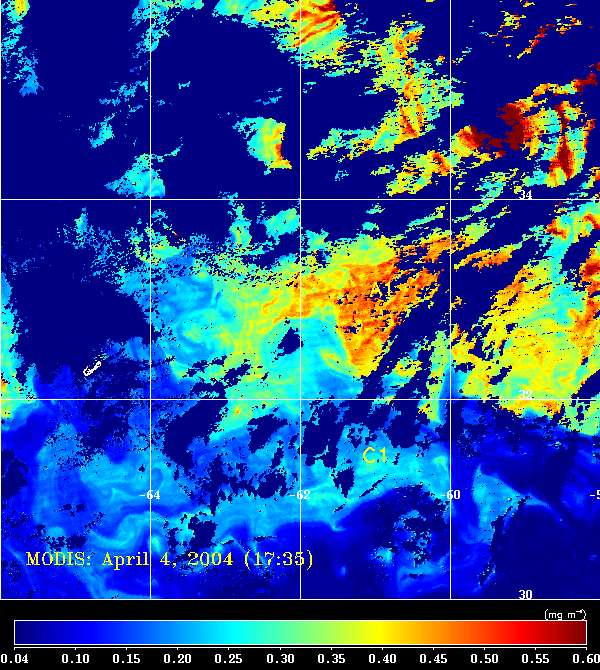
Image acquired April 4, 2004 shows that chl-a concentration in area
occupied by A1 eddy is increased significantly. A tongue of low chl-a
water which is associated with A2 eddy, almost completed anticyclonic
rotation. Also, "C1" eddy is visible.
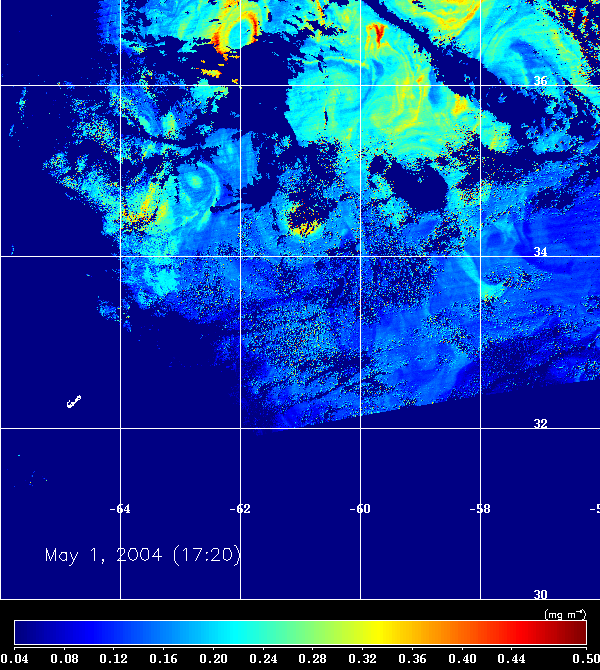
Two consequtive images obtained on April 30 and May 1, do not show any
features of interest.
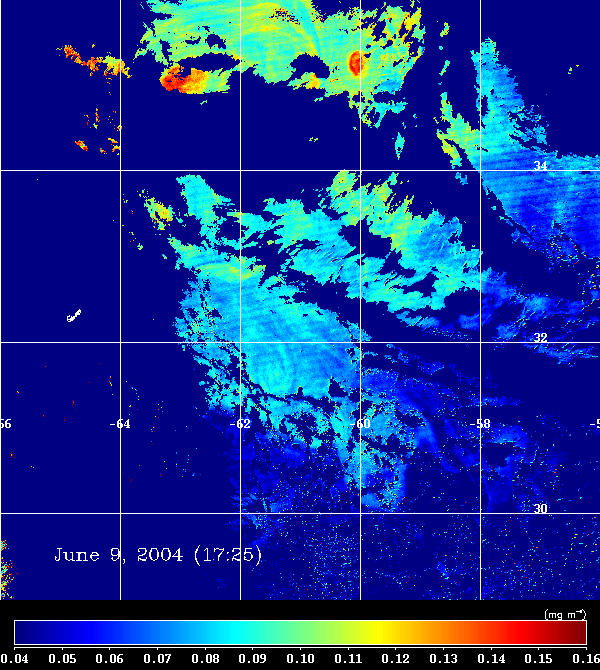
May-June 2004.
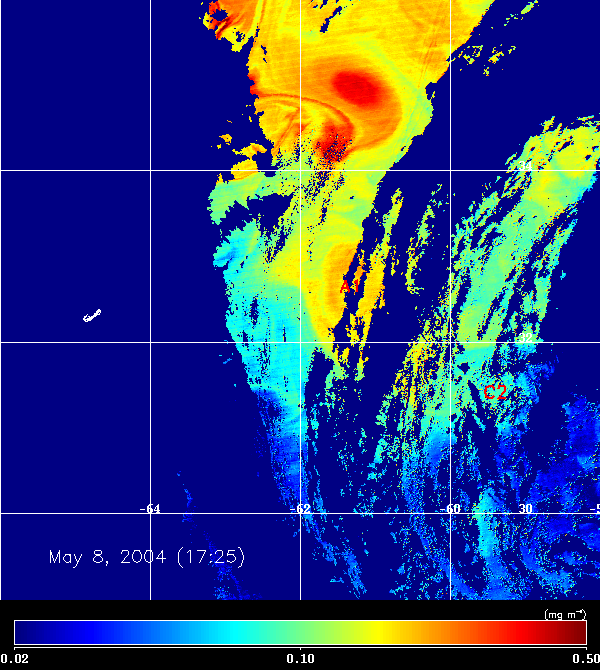
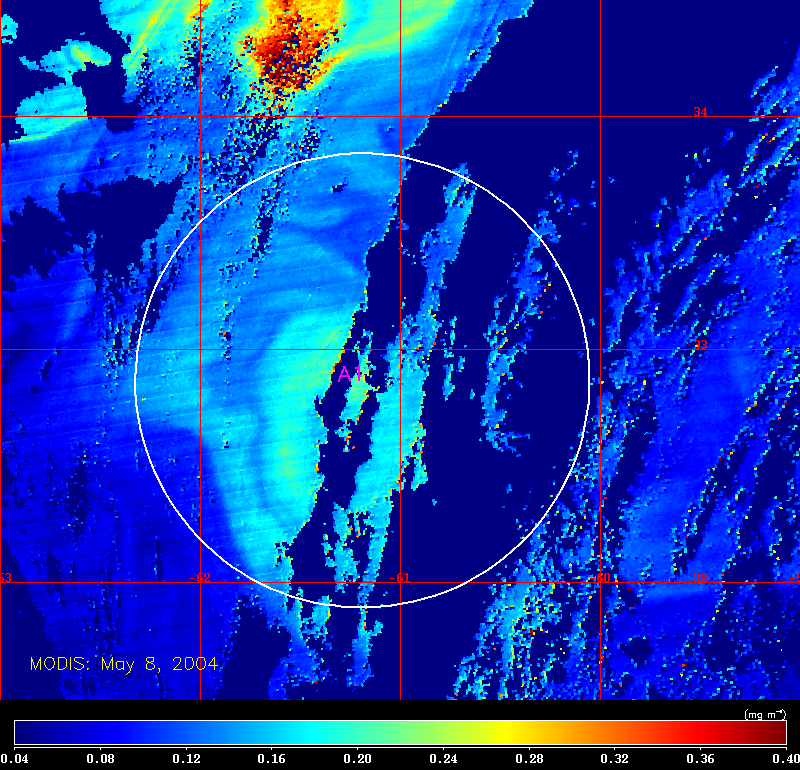
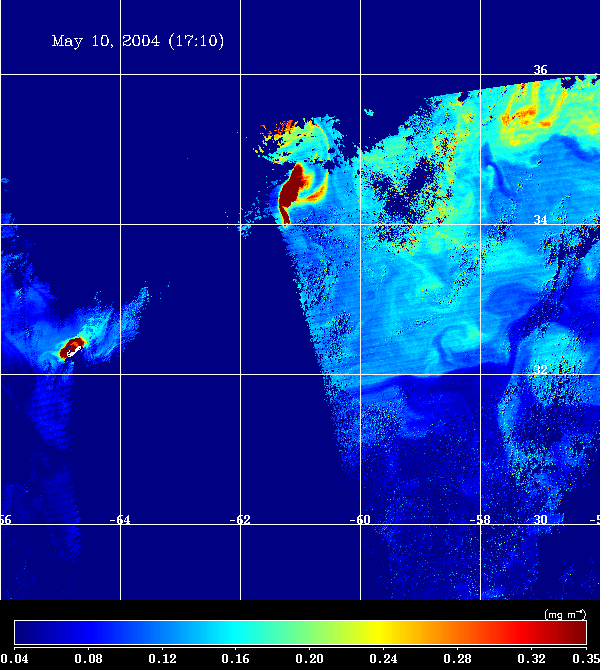
Next image was obtained on May 8, 2004. At this time of the year the
spring bloom rapidly utilizes the nutrient in the surface waters,
and the subsurface deep chlorophyll maximum (DCM) begins to develop.
Also, as water column stratification continues to intensify below the
shallow mixed layer, the seasonal thermocline inhibits further
nutrient enrichment of the surface waters. Despite this reason color
image shows concentration in the area associated with the position
of A1 eddy is high enough to conclude that this increase is a result of
vertical processes inside the eddy but horizontal advection.
Position of eddy C2 is also indicated.
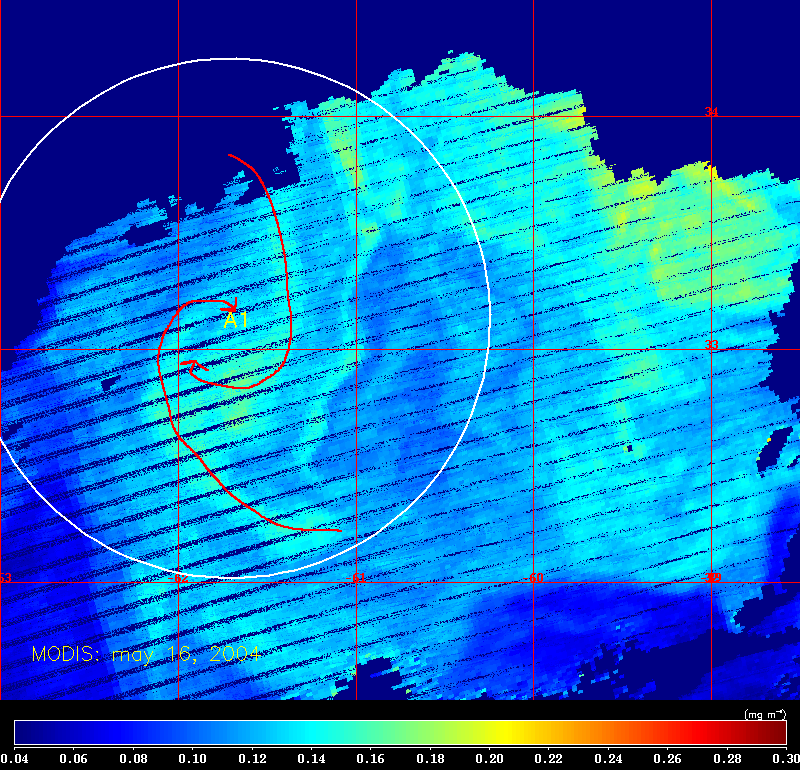
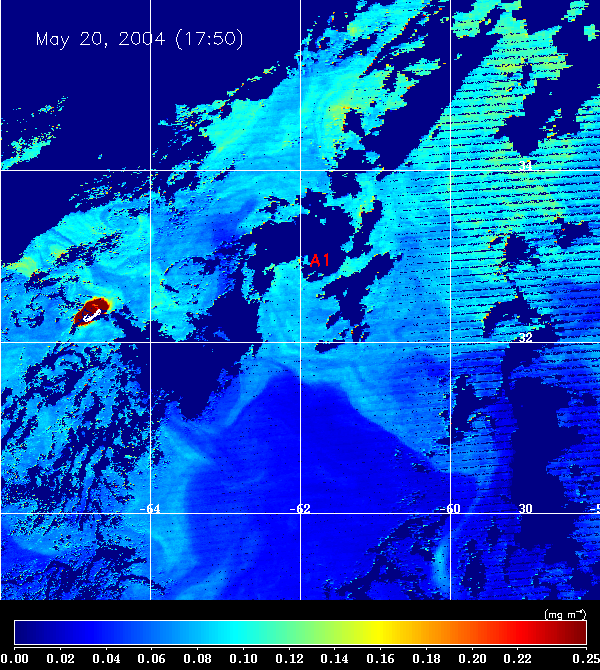
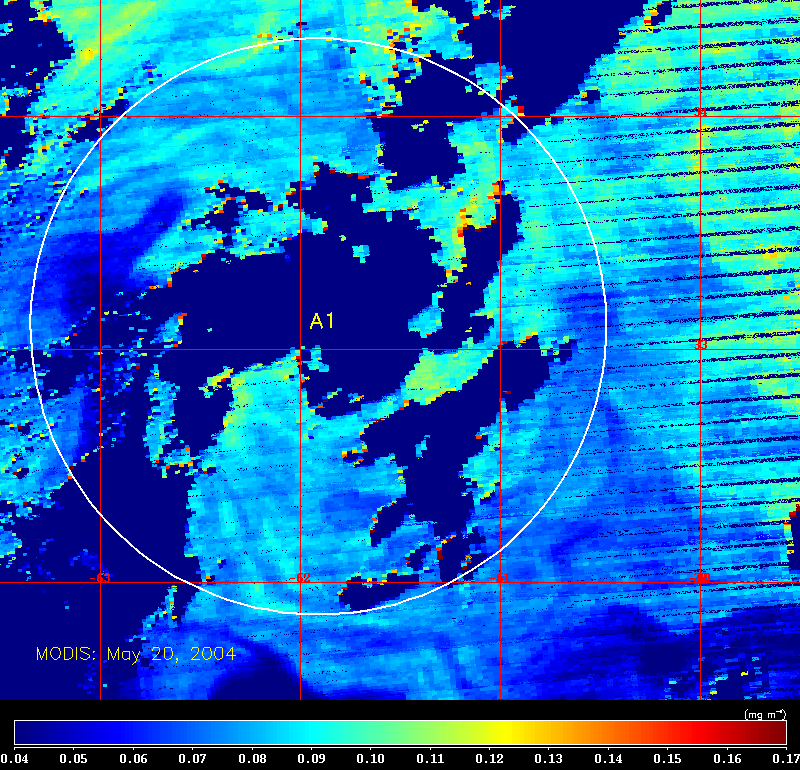
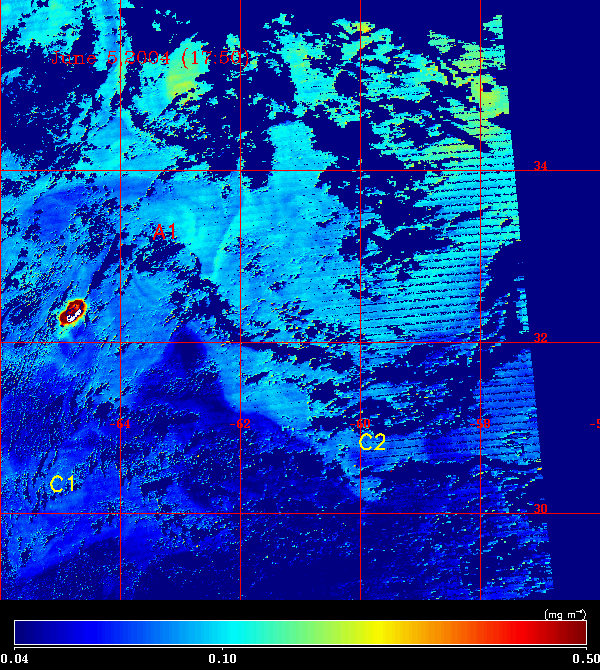
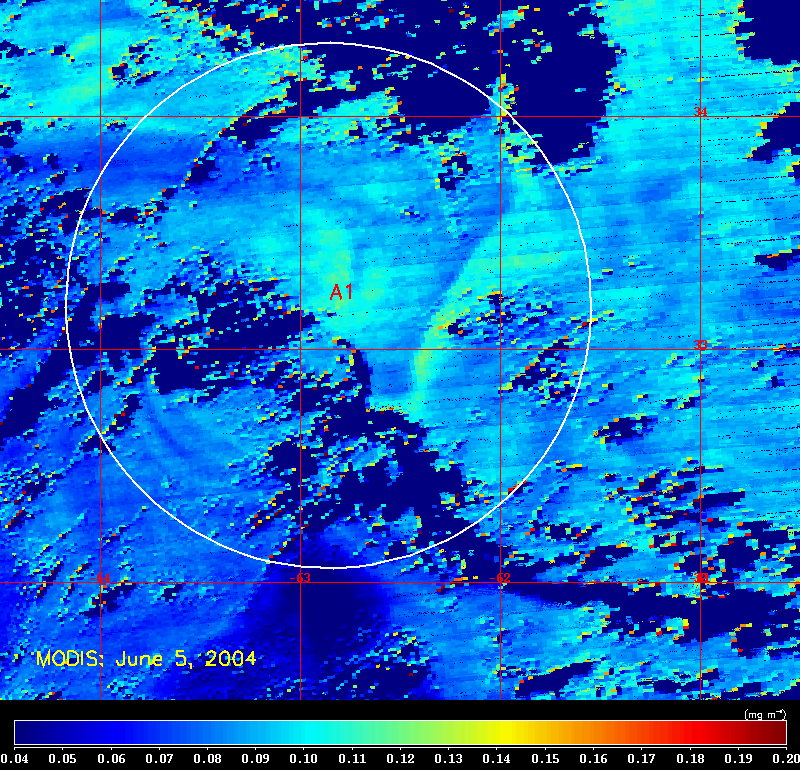
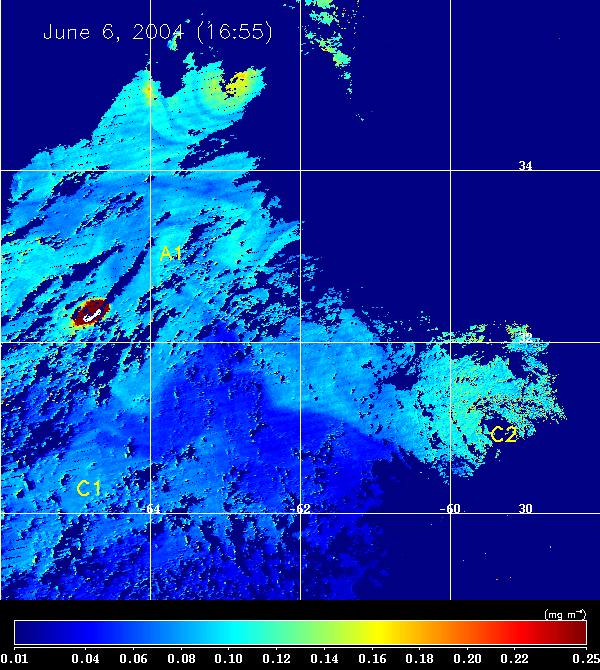
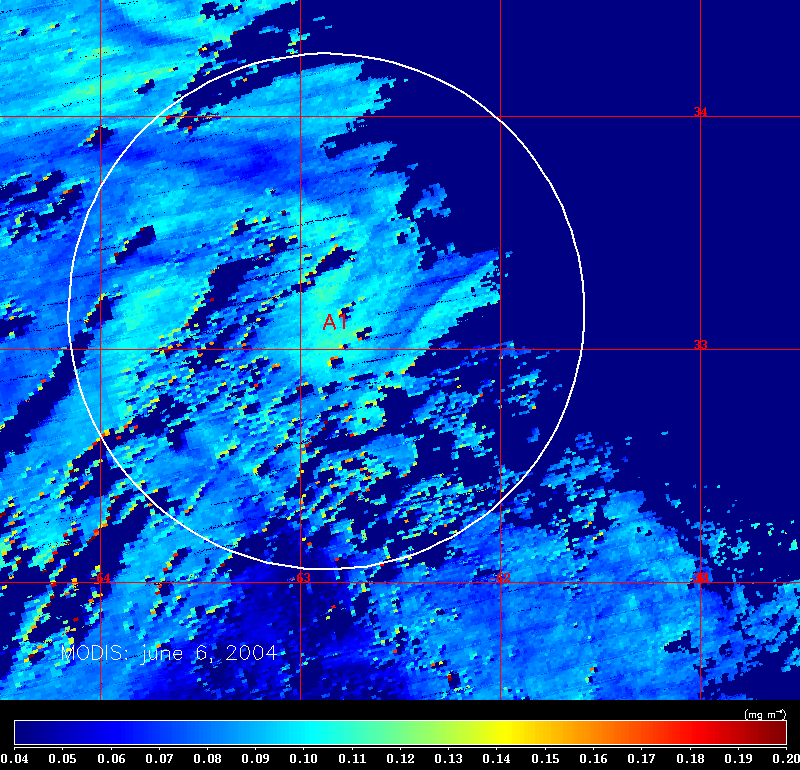
On images obtained on May 20, June 5, and June 6, 2004, eddy A1,
migrating to the west, is still may be tracked due to chl-a pattern
showing anticyclonic rotation. The higher chlorophyll values in A1
center appear to be advected from the northern, cyclonic eddy. The
drawing of water from cyclonic eddy can explain why the anticyclonic
eddy has high chl-a concentration and the cyclonic eddies C1 and C2
have low chl-a concentration. Examining these images showed that
beginning from early May anticyclonic eddy A1 draws chl-a rich
chl-a waters from the northern eddy. Cyclonic eddies moving
through the relatively clear water form DCM which may be not detected
onboard the satellite. Note a large area of specific (similar
to triangle) form with very low chl-a concentration centered on 30N,
62W. It is interesting that this low chl-a pattern may be tracked
down in all images (until June 17) but it is unclear which mechanism
forms this pattern.
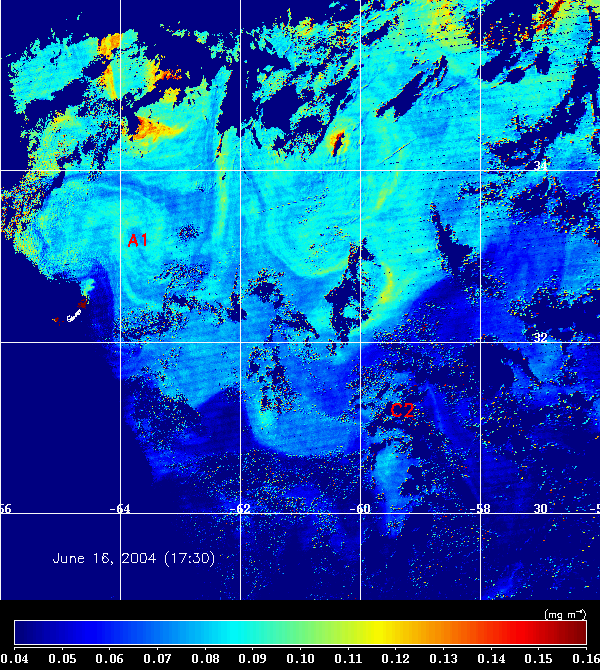
A clear sky image acquired June 16 shows intense streamer drawing high
chlorophyll waters from north in the southward direction. Approximately
near 33N, this streamer changs its direction and high chl-a values
appear to be advected into the western, anticyclonic and cyclonic
eddies. Comparison to altimetry map shows that position and
direction of this streamer, originally formed from Gulf
stream, coinside with the eastern periphery of the long anticyclonic
feature extending from northern boundary up to A1 eddy.
Unfortunately, we don't have a possibility to to identify this streamer
in ADCP data: ship's track didn't cross it. The only small part of ADCP
data revealed a southwest jet-like current near 32.5N, 62.5W. Position
of C2 eddy is also indicated.
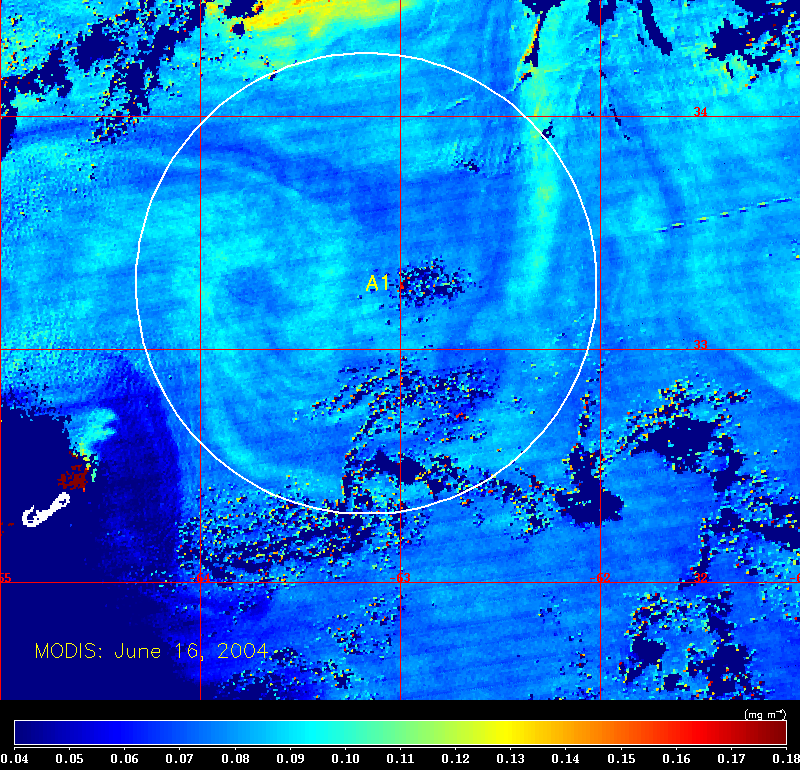
MODIS image acquired next day, shows a body of high chl-a water
accumulated inside A1 eddy. A small (southern) part of the streamer is
still presented on the image.
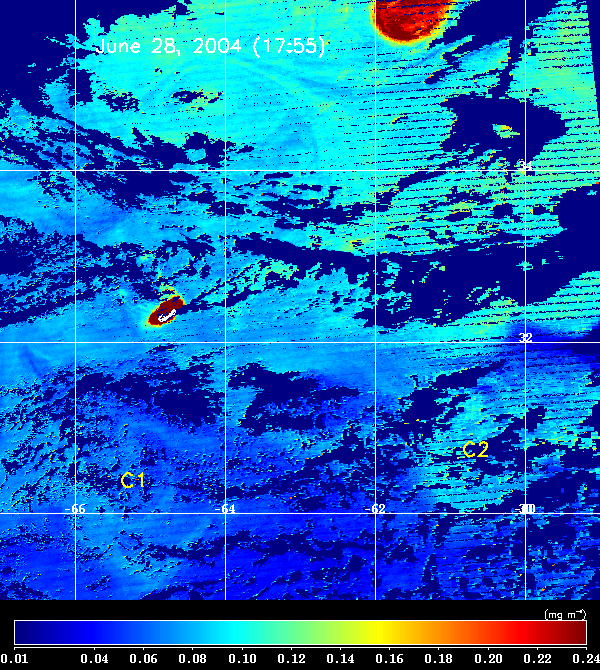
Althought the image obtained on June 28, 2004 is 70% clear sky, it is
difficult to identify any chl-a patterns with A1 eddy. The higher
chl-a
values near 30.75N, -60.75W appear to be cyclonic eddy C2. Location of
another one cyclonic eddy C2 is evident due to cyclonic-like swirl at
30.25N, 65.0W.
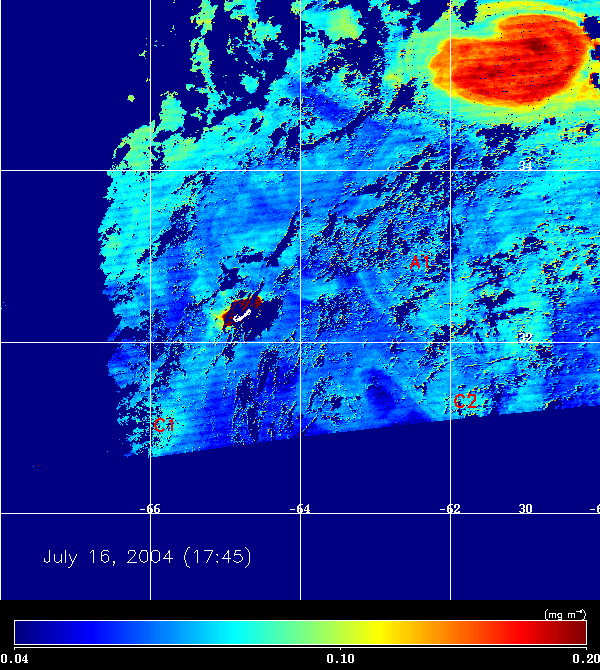
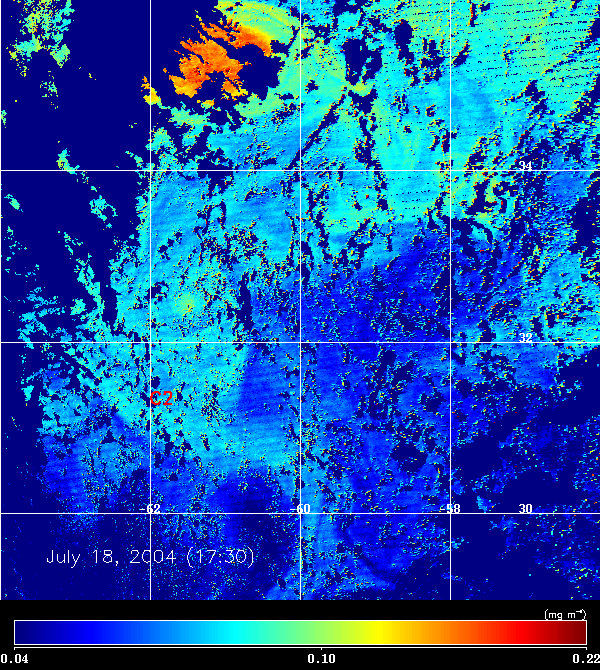
On three consecutive images
acquired July 16, 17, and 18, the only location
of the cyclonic eddies C1 and C2 may be identified.
|