ACADIA model: numerical experiments
| In our study we used the ACADIA model version 4, with 3D climatological bi-monthly velocity and temperature/salinity fields used as input. These fields are model generated circulation and temperature/salinity structure fields representing bi-monthly mean conditions. We focus in detail on the two spring periods, March-April and May-June and on the summer period July-August to simulate alongshore transport of offshore algal blooms in the Gulf of Main. A finite element formulation of the non-conservative form of the vertically averaged Advection-Diffusion-Reaction equation that tracks depth-averaged single transport variable - Alexandrium tamarense cells concentration was used for simulation. |
| Investigation of the climatological mean
seasonal cycle of Alexandrium tamarense consists of 6 separate
6 month long runs. In each experiment, zero cells concentration was used
as initial condition, then velocity and temperature/salinity fields
from a particular period were specified (runs 1-2, 5-7 ). In some experiments
a boundary condition 10 cells/l flowing in through the open boundary
in the Bay of Fundy was used (runs 3-5). An additional experiment was conducted
assuming initial cells concentration equal to 10 cells/l (run 4).
In all the above mentioned experiments it was assumed that the only light
is a factor limiting growth rate of the cells. Finally, one more run with
nutrient limitation has been performed (run 6).
Below these runs are described and discussed in terms of the Gulf of Main circulation scheme outlined in Lynch et al, 1997. All runs are performed on 'g2s.5b' finite element mesh which includes Bay of Fundy domain. |
Table 1 Summary of Model Parameters
|
attenuation coeff (water) |
attenk = 0.20 | 1/meter |
|
attenuation coeff (sedim) |
attens = 3000 | 1/meter |
|
day light averaged irradiance |
rad = 280 | watt/m^2 |
|
maximum growth rate |
G_max = 0.60 | 1/day |
|
maintenance respiration rate |
Gr = 0.05 | 1/day |
|
growth efficiency |
G_eff = 0.017 | m^2/day/watt |
|
grazing/mortality |
Graze = 0.1 | 1/day |
|
DIN half-sat constant |
aksn = 1.5 | mkg/l |
|
"light" irradiance flux |
L_light = 2.4 | watt/m^2 |
|
"dark" irradiance flux |
L_dark = 0.024 | watt/m^2 |
Table 2 Run table
|
Time period |
Initial condition | Inflow boundary | Biological model | *.fli movie name | data/obs comp (1998) |
|
March 1 -August 20 |
C = 0 | C = 0 | germ, growth, mort | cell98_a1.fli | cell98_a1.jpg |
|
same |
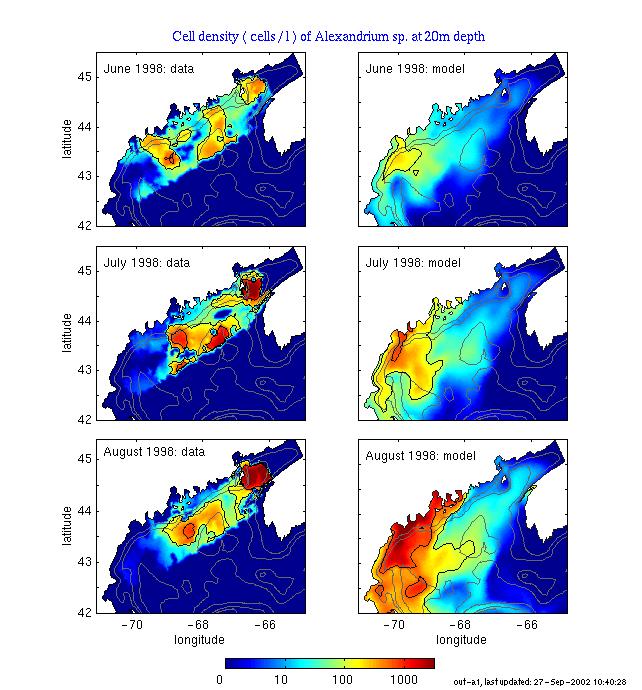
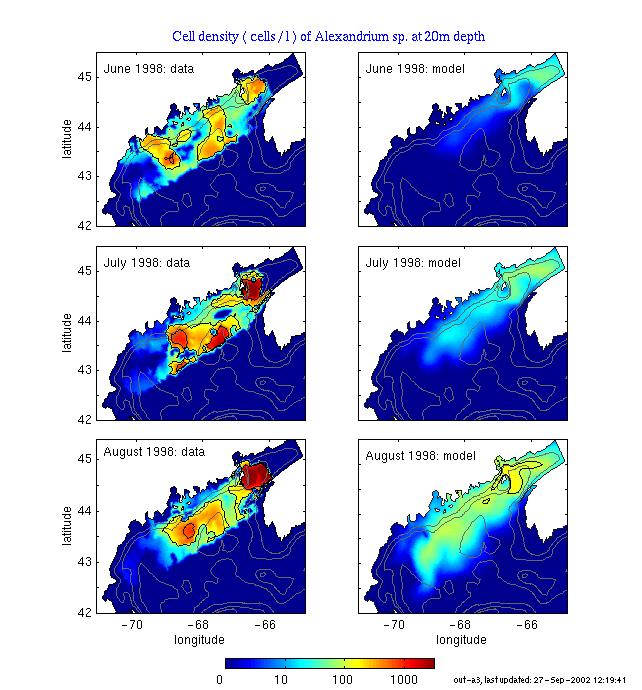
C = 0 | C = 10 | growth, mortality | cell98_a3.fli | cell98_a3.jpg |
|
same |
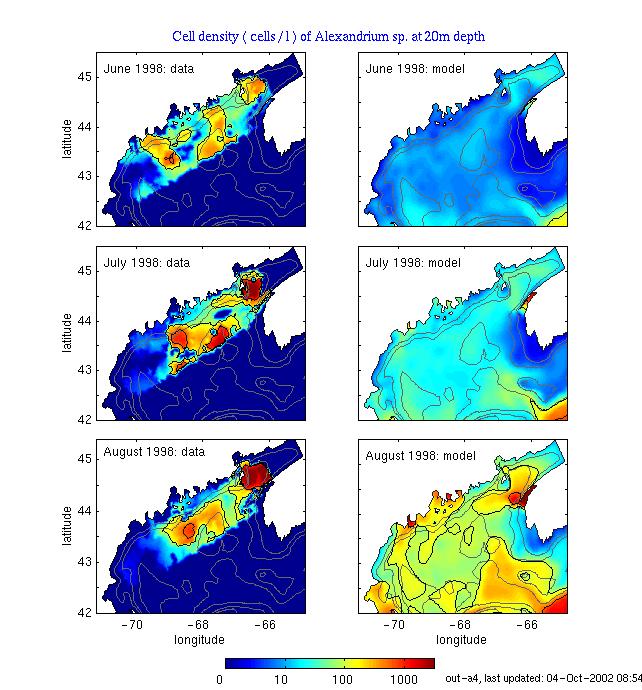
C = 10 | C = 10 | growth, mortality | cell99_a4.fli | cell98_a4.jpg |
|
same |
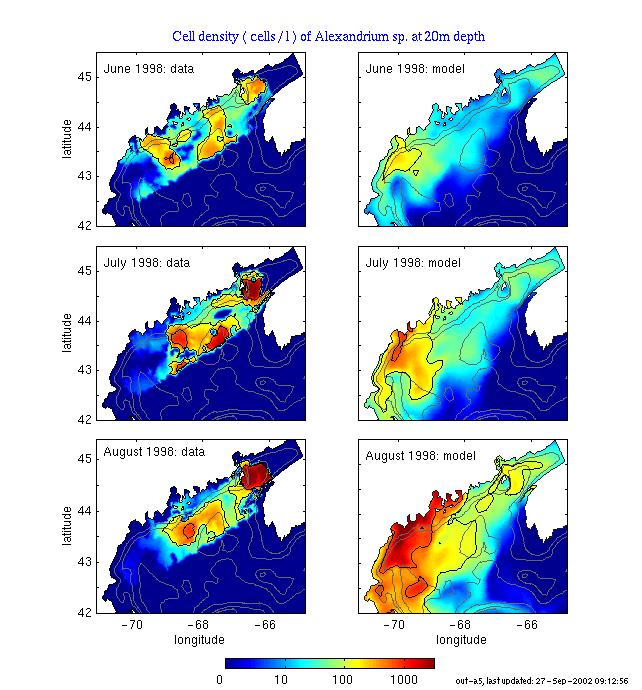
C = 0 | C = 10 | germ, growth, mort | cell98_a5.fli | cell98_a5.jpg |
|
same |
C = 0 | C = 0 | germ | cell98_a6.fli | cell98_a6.jpg |
|
same |
C = 0 | C = 0 | germ, growth, mort,
nutrient limitation |
cell98_a7.fli | cell98_a7.jpg |
|
same |
C = 10 | C = 10 | growth, mort, nutrient
limitation |
cell98_a8.fli | cell98_a8.jpg |
| sc98c1.fliis
the original Rich Signell's animation.
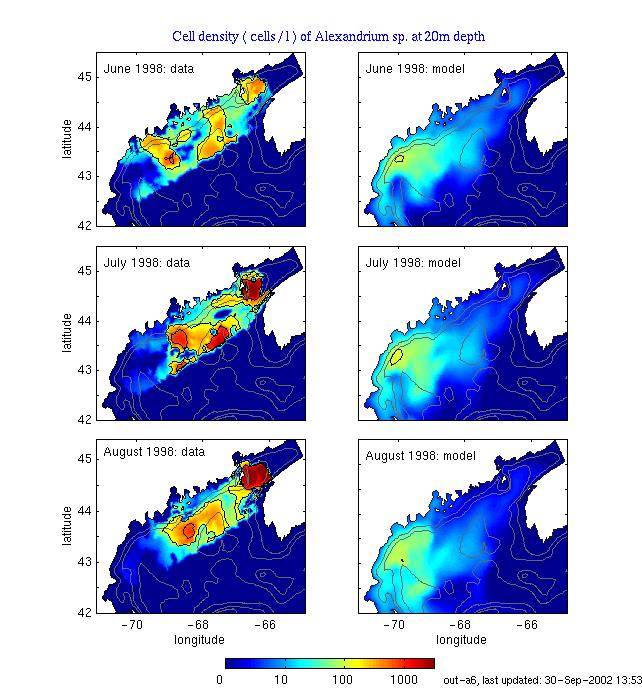
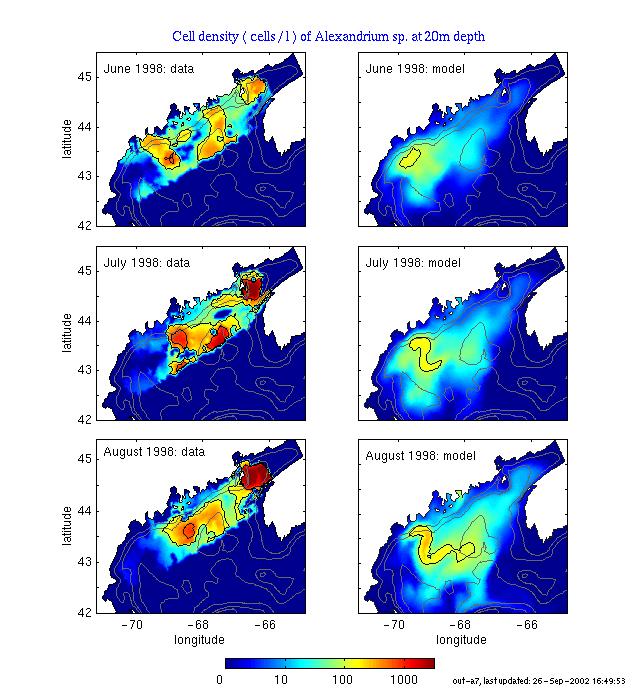
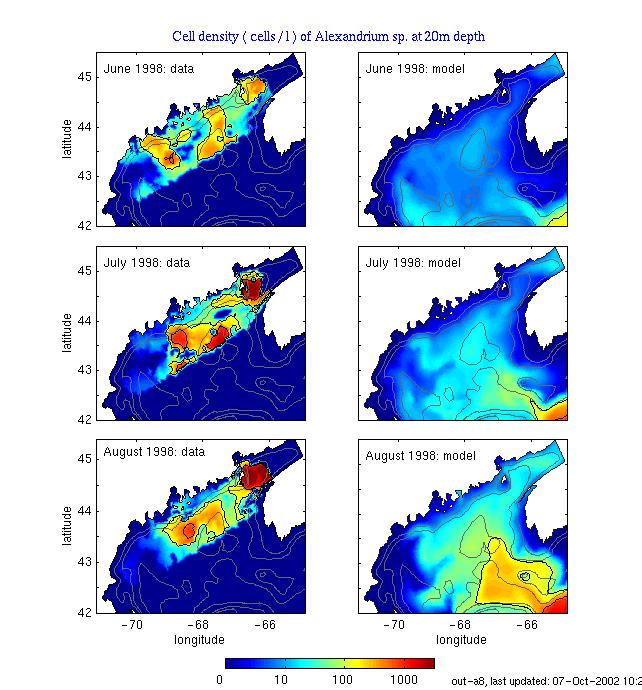
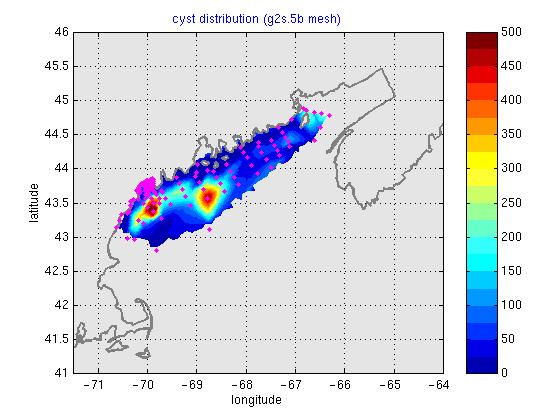
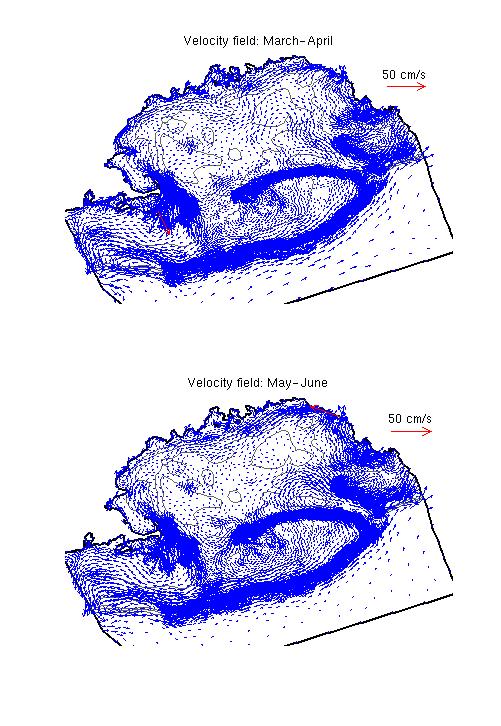
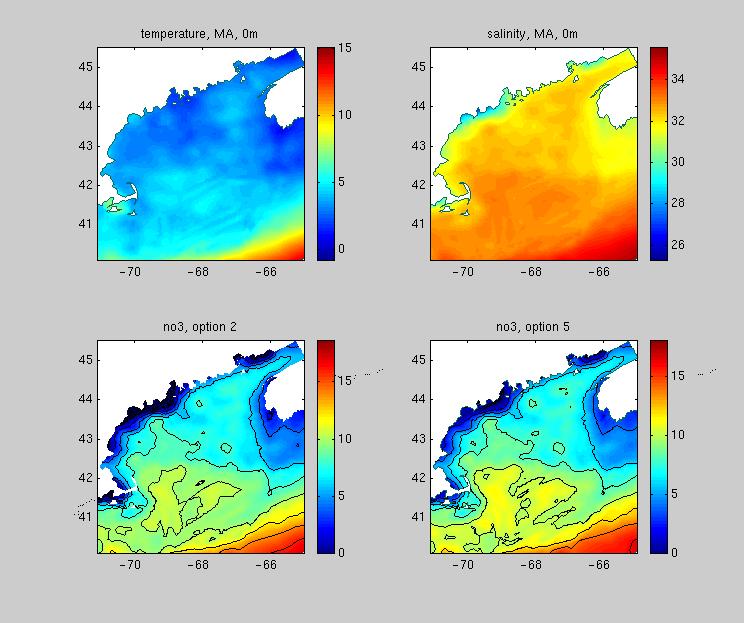
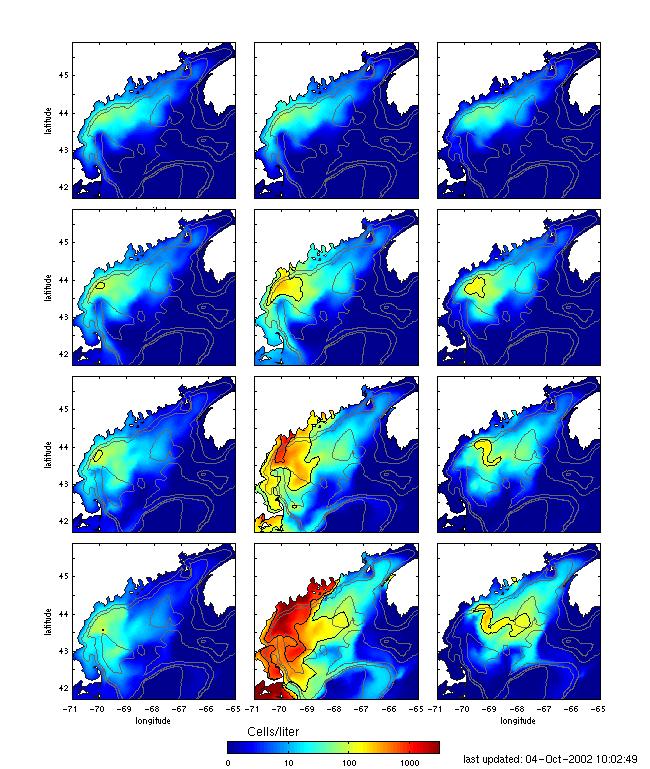
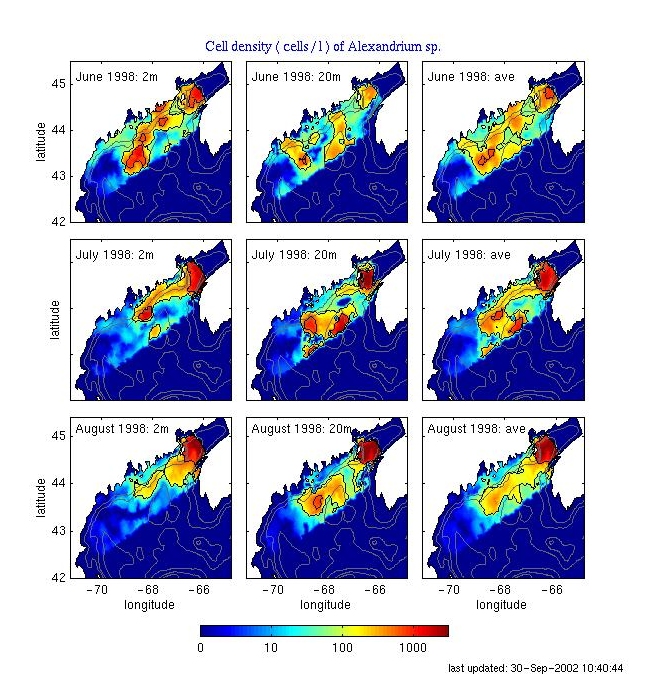
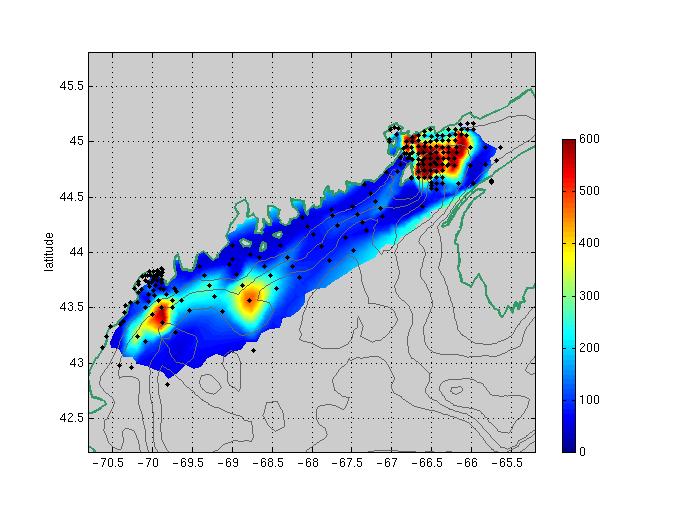
run a1. cell98_a1.fli Basic run. Initial cells concentration is set to zero, germination, growth and mortality included. Initial distribution of Alexandrium cysts in the upper 1 cm of bottom sediments, derived from a survey in October 1997, displayed in init_cyst.jpg. Two maxima in cysts distribution are clearly seen there: approximately between isobaths 75 and 150 m offshore of Kennebec River and Penobscot Bay. Also, an additional maximum may be tracked in the Bay of Fundy. Climatological velocity fields for two two bi-monthly periods are displayed here. Run starts on March 1, 1997 when the endogenous clock is on. run a3. cell98_a3.fli Initial cell concentration is set to zero, no germination, the only grows and mortality are included. There is a cell flux 10 cells/l flowing in through the open boundary in the Bay of Fundy. run a4. cell98_a4.fli Initial cell concentration is set to 10 cell/l; no germination, the only growth and mortality are included. There is a cell flux 10 cells/l flowing in through the open boundary in the Bay of Fundy. run a5. cell98_a5.fli Initial cells concentration is set to zero, germination, growth and mortality included. There is a cell flux 10 cells/l flowing in through the open boundary in the Bay of Fundy. run a6. cell98_a6.fli Initial cells concentration is set to zero, the only germination included. There is no cell flux flowing in through the open boundary in the Bay of Fundy. run a7. cell98_a7.fli Initial cells concentration is set to zero, germination, growth, mortality and nutrient limitation are included. NO3 distribution has been derived from the climatic temperature and salinity fields using a regression formula. Example of such distribution NO3 field received from the March-April climatology in case of two different regressions (2 and 5) is displayed here. run a8. cell98_a8.fli Initial cell concentration is set to 10 cell/l; no germination, the only growth, mortality, and nutrient limitation are included. There is a cell flux 10 cells/l flowing in through the open boundary in the Bay of Fundy. A composite of cell distribution for 3 model
runs: a6, a1, and a7 on May 15, June 15, July 15, and August
15 is presented in cell_model_a617.jpg.A
seperate plot displaying results of run a6 may be found here: cell_model_a6.jpg.
A composite for runs 3, 4 is in
cell_model_a34.jpg.
|
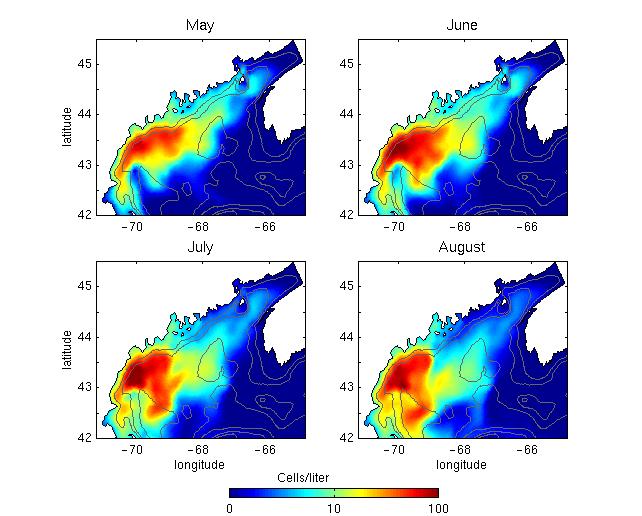
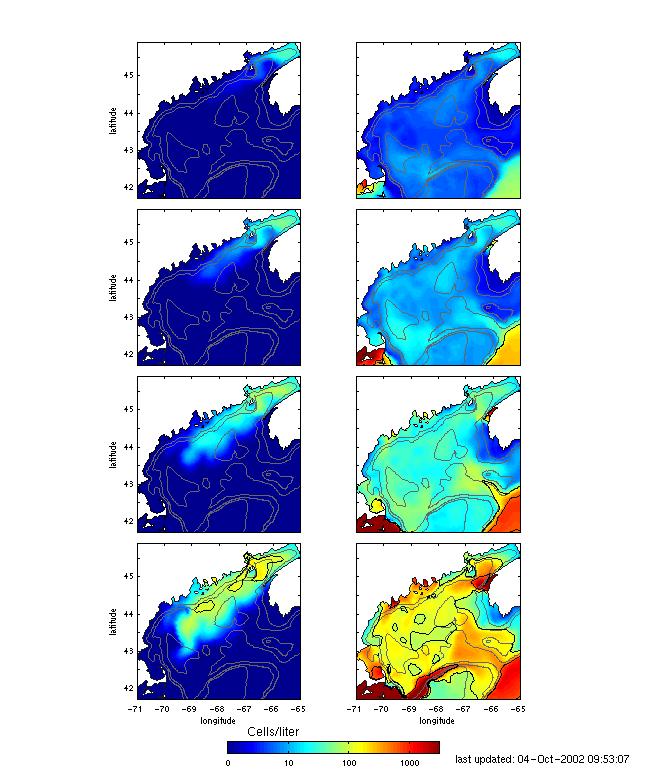
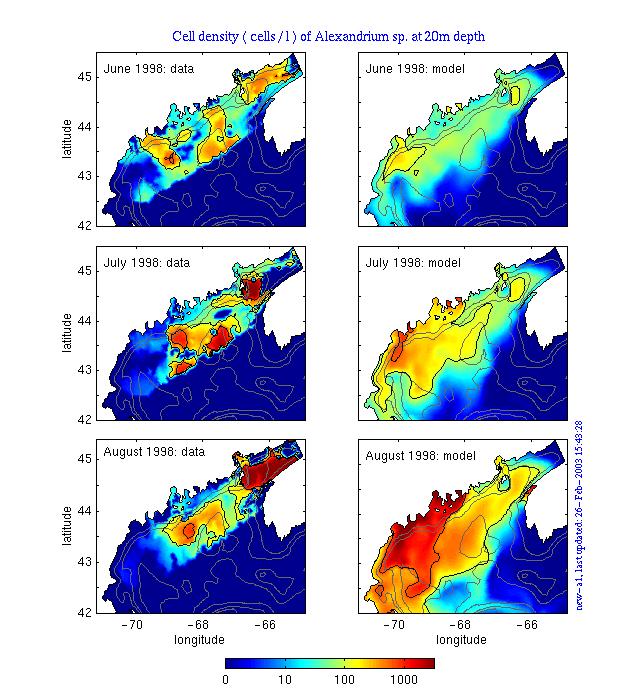
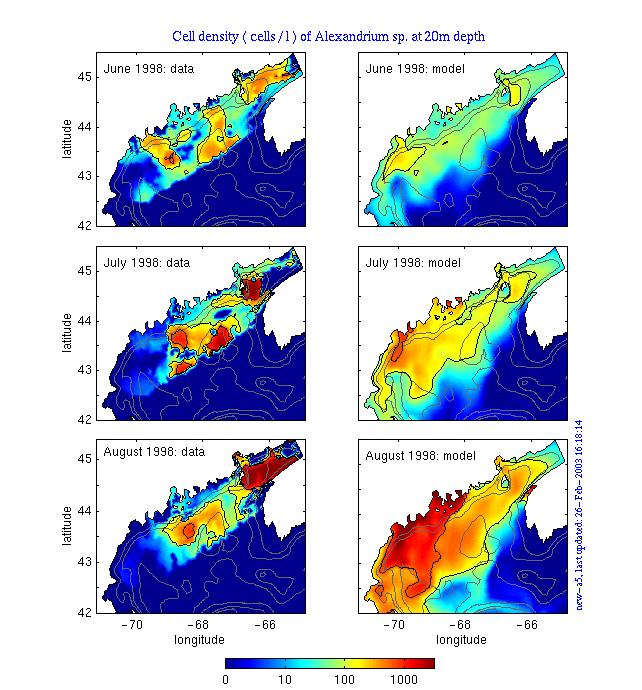
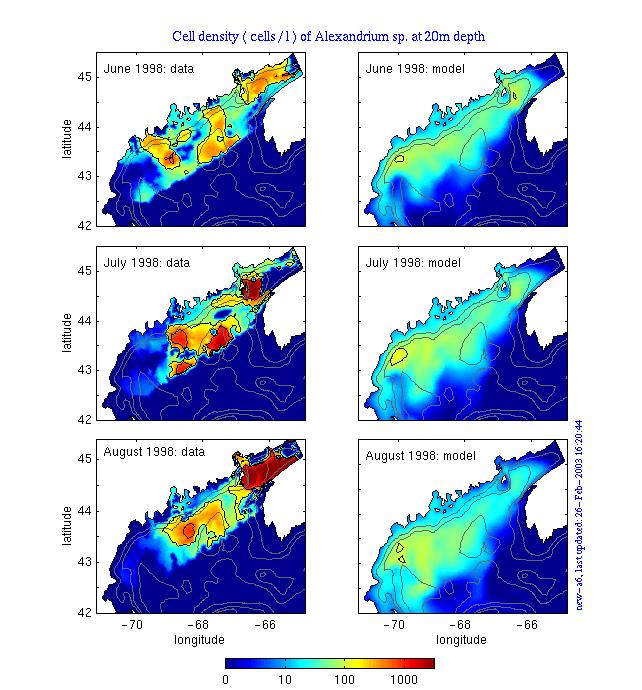
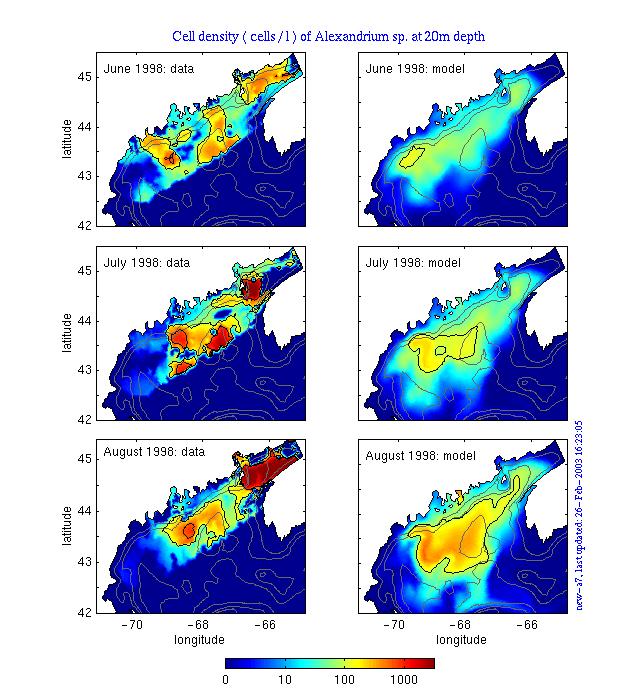
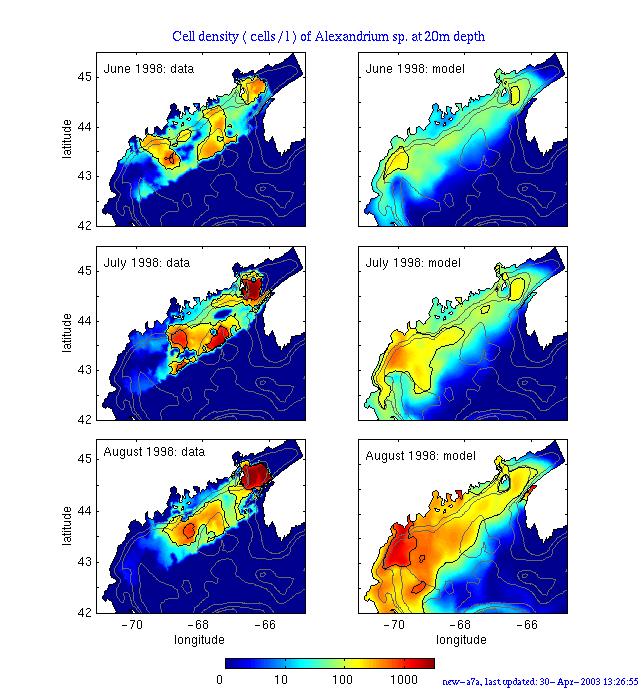
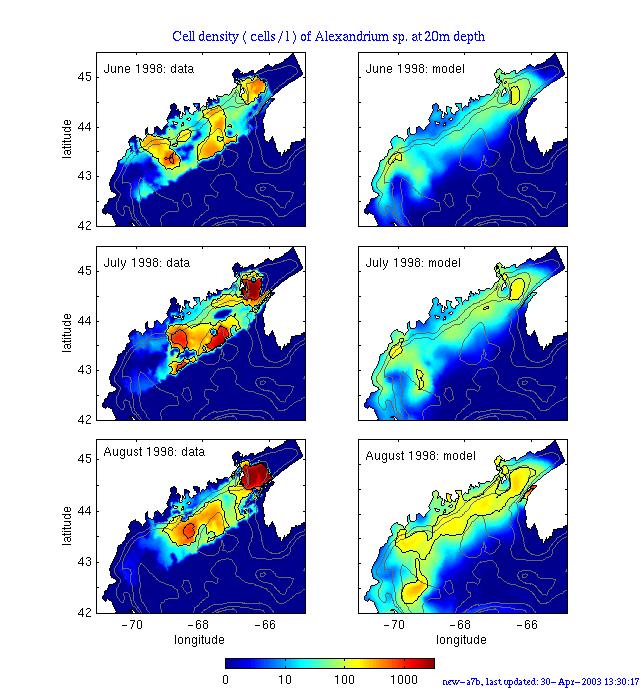
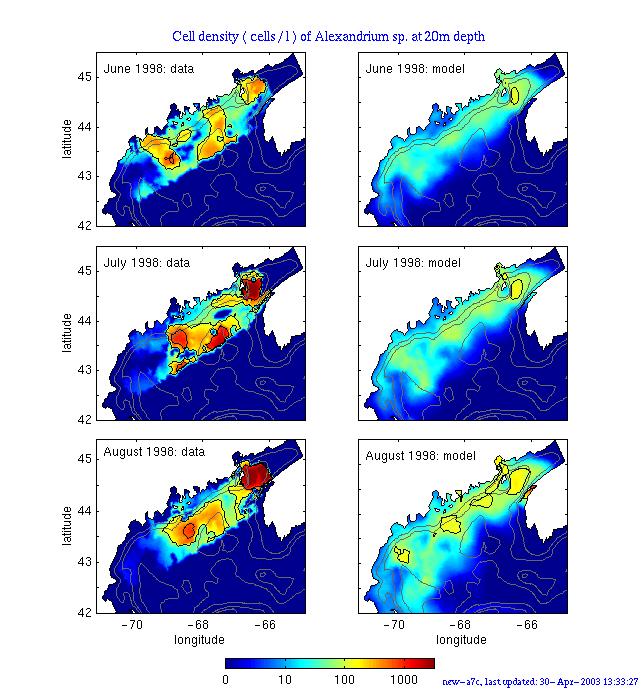
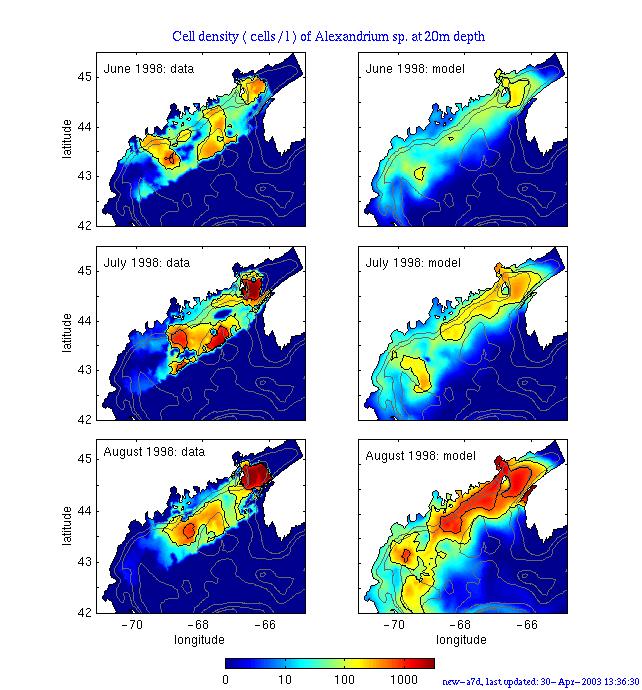
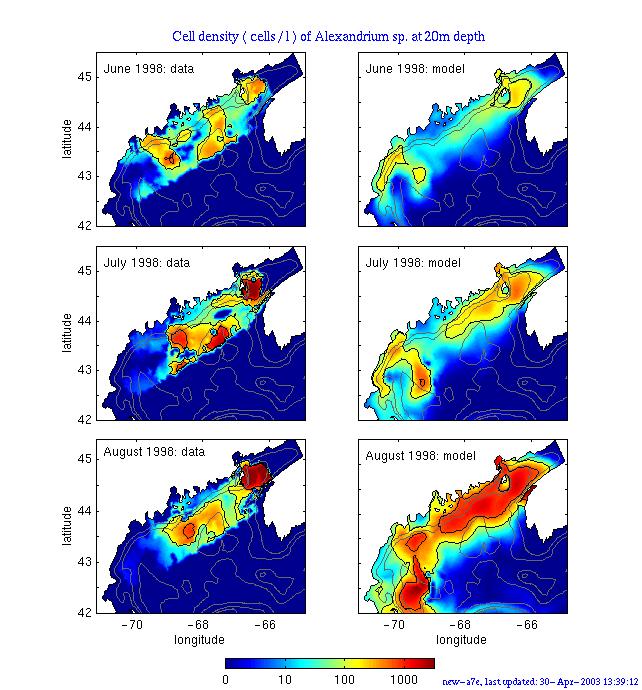
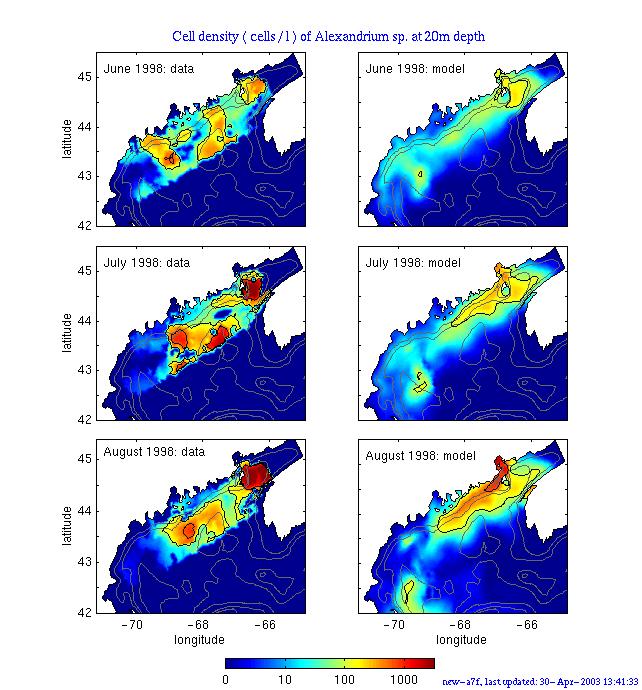
| Cell densities (number of cells / l)
of Alexandrium sp. at 2m, 20m, and the average of these two centered
on June 11, July 11, and August 11 1998 are shown here: cell98_data_ave.jpg.
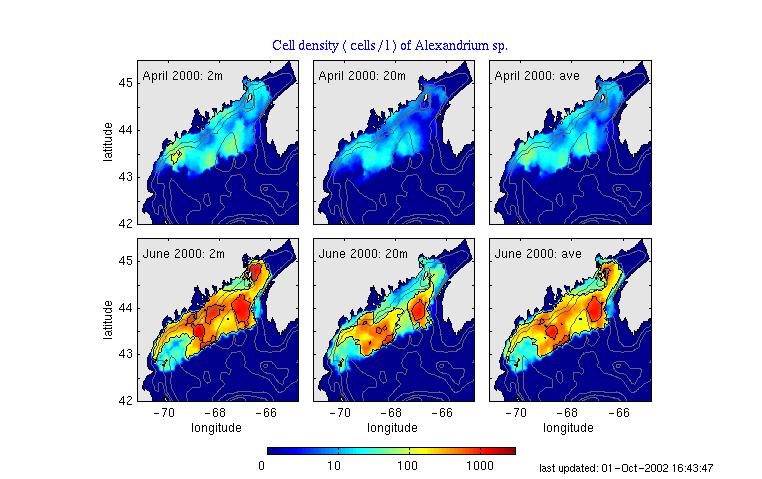
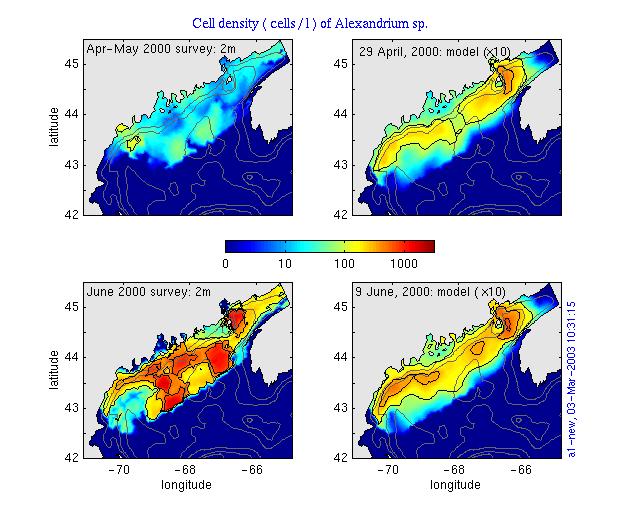
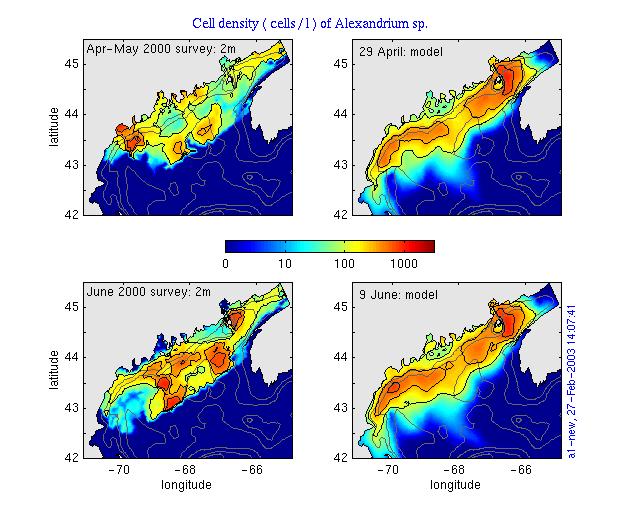
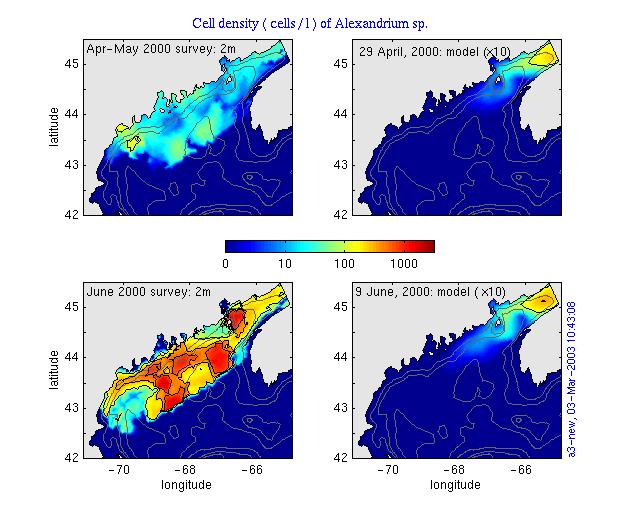
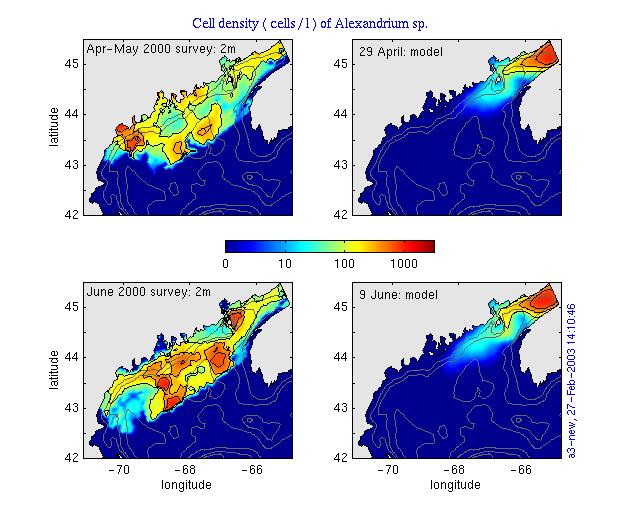
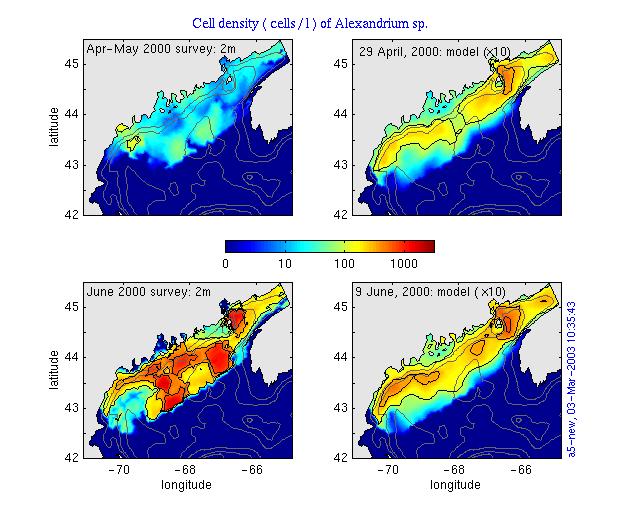
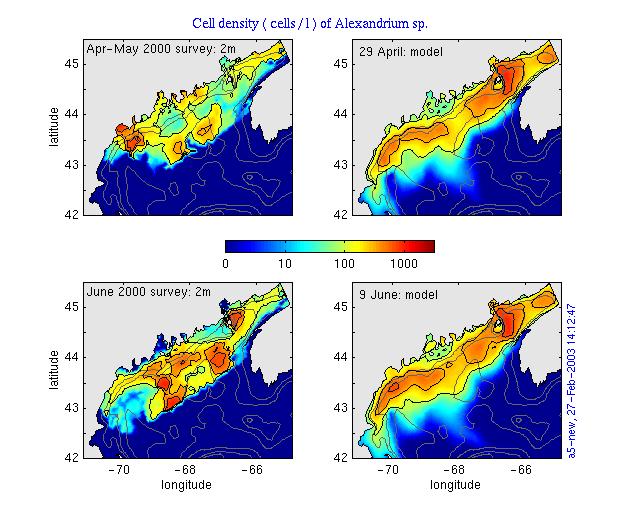
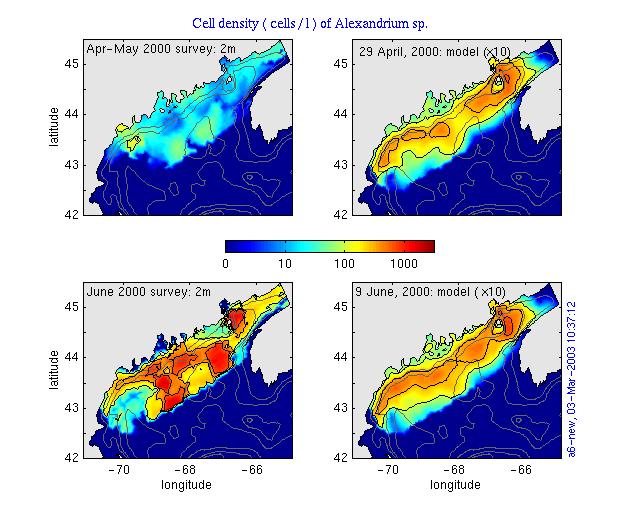
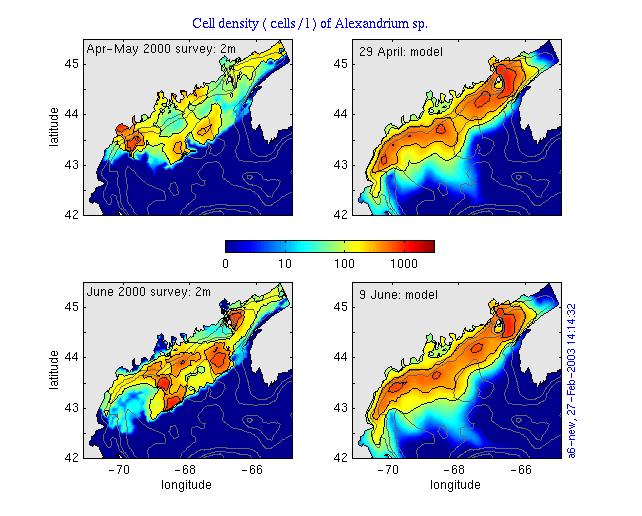
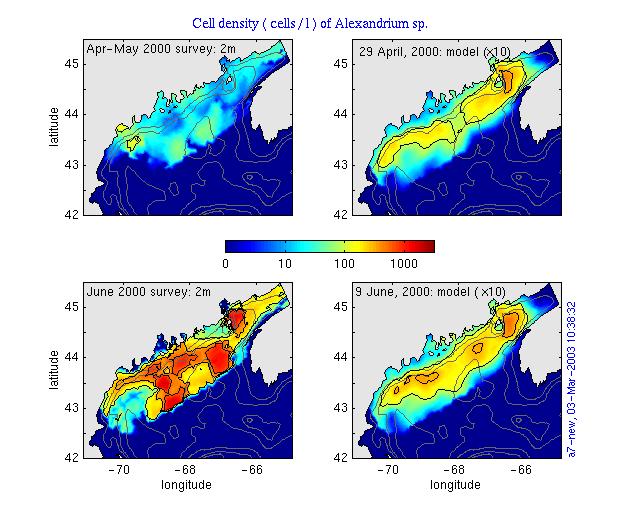
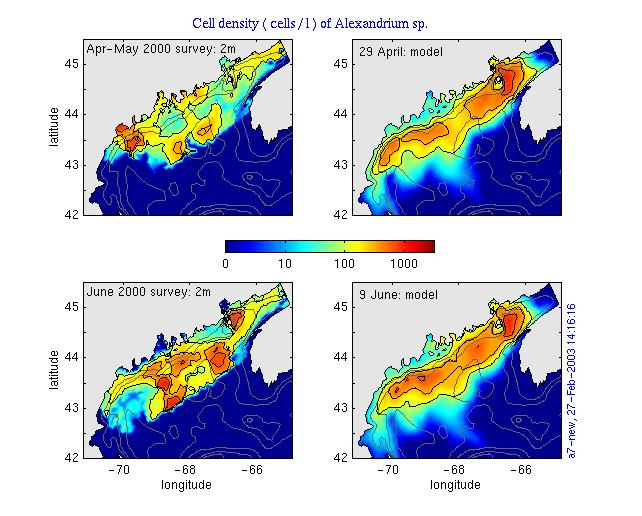
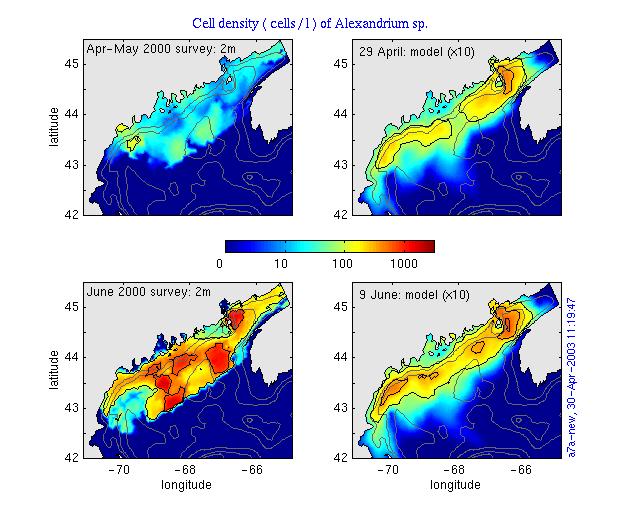
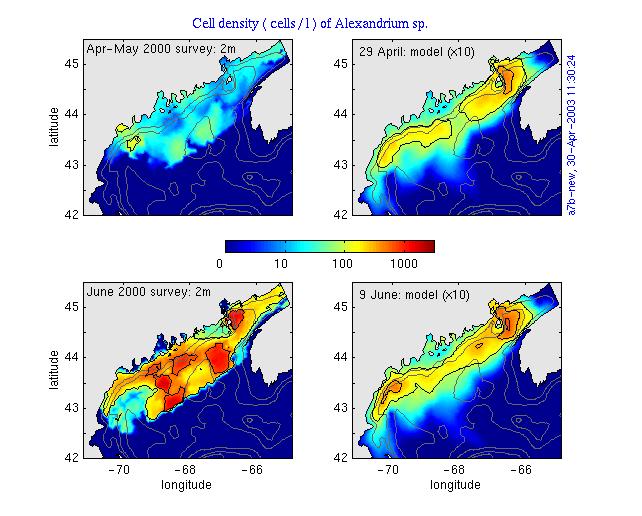
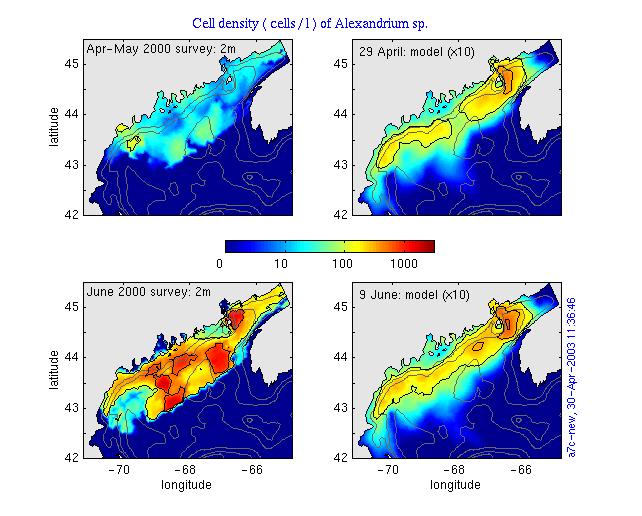
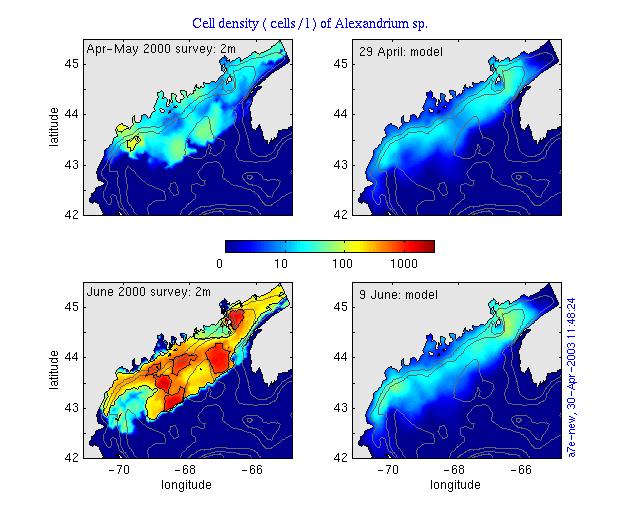
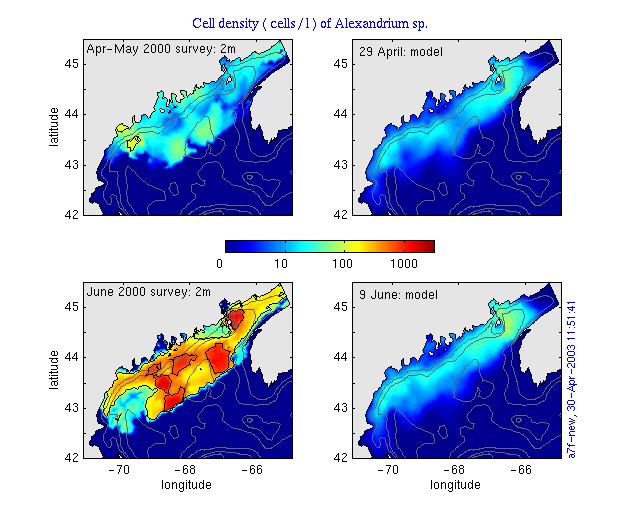
Cell densities for 2000 survey cruise centered on April 29 and June 9 are
shown in cell2000_data_ave.jpg.
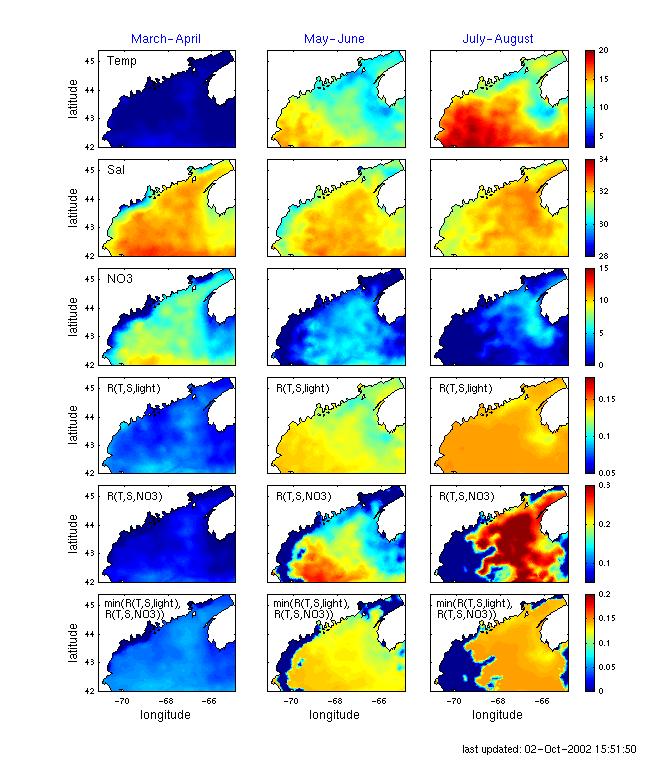
The 100 and 600 cells/l contour lines are given. A growth rate diagnosis based on the climatical March-April, May-June, and July-August bi-monthly fields is presented here: cell98_diagn.jpg. Notes on frames. Rows 1, 2: Temperature and salinity at the uppermost level. Row 3: NO3 field restored from the climatological temperature and salinity fields using a regression relation. Row 4: The growth rate (1/day) depending only on light limitation. Row 5: The growth rate (1/day) dependent only on nutrient limitation. Note on equations used to compute NO3 field and growth rates. NO3 = max(0,NO3'), NO3' = -144.8 - 0.38 * T + 4.75 * S (option 2) R-light = (G_max * G_fac + Gr) * tanh(G_eff * Rad/(G_max * G_fac + Gr)) - Gr , light limitation R-no3 = G_max * G_fac * NO3/(NO3 + aksn), NO3 limitation,
R = min(R-light, R-no3) - Graze, light and NO3 limitation
G_fac = T_fac * S_fac,
|
updated on 02/26/2003
| A new set of Alexandrium
cysts distribution in the upper 1 cm of bottom sediments, derived from
the 1981-83 cyst observations, has been added to that one from 1997 observations.
Both sets have been merged and the final cyst distribution displayed in
figure cyst_comp.jpg.
Then, using this new distribution, runs a1,a5,a6, and a7 have been repeated
and the results of new computation are presented in Table 3.
A new run a9 ( similar to a4 ) has been added to the prvious ones. Initial cell concentration was set to C=100 cells / l and restricted by the area where observations are available, and C=0 elsewhere. No germination, the only growth and mortality processes are included in the model. It is interesting to analyze runs a6 and a9. Run a6. Due to the process of cyst germination cell concentration in the Eastrern Gulf of Main is higher then in WGM. Cell concentration gets its maximum there at the end of June, then declines slowly during the July/August bi-monthly period. In a contrary, cell concentration in the Western Gulf of main gets its maximum at the end of July, then decreasing slowly during August. There is still enough cysts to maintain high level of cell concentration in the ephotic layer. Run a9.
During the March/April bi-monthly period cell concentration in the entire
Gulf of Main , initially homogeneous, gets slowly to decline. During next
bi-monthly period -- May/June cell concentration starts to increase so
that by the end of June the highest cell concentrations occur in the Bazzard
bay and the Wynyard Sound areas. All this time cell concentration in the
EGM went to zero. During July/August there was an active cells growth in
the Western Gulf of Main but in the eastern part.
|
Table 3 Run table
|
Time period |
Initial condition | Inflow boundary | Biological model | *.fli movie name | data/obs comparison |
|
March 1 -August 31 |
C = 0 | C = 0 | germ, growth, mort | cell98_a1_new.fli | cell98_a1_new.jpg |
|
same |
C = 0 | C =10 | germ, growth, mort | cell98_a5_new.fli | cell98_a5_new.jpg |
|
same |
C = 0 | C = 0 | germ | cell98_a6_new.fli | cell98_a6_new.jpg |
|
same |
C = 0 | C = 0 | germ, growth, mort,
nutrient limitation |
cell98_a7_new.fli | cell98_a7_new.jpg |
|
same |
C = 100 | C = 0 | growth, mortality | cell98_a9_new.fli | cell98_a9_new.jpg |
| A two additionall data sets derived from the April/May and May/June 2000 surveys were used to compare a model data to observations. The first survey was centered on 29 April, 2000, and the second one on 9 June, 2000. Both surveys were conducted at the early stages of the model run when cell concentration in the entire domain was at least an order of magnitude lower then it is evidenced from observations. To make model and observations comparable, we used 2 methods: 1) simply multiply model data by the factor 10, or normalize data and observations. For normalizing, each data set was initially devided by its maximum value then multiplied by factor 1000 ( to keep cell concentration within known level between 0 and 1000 cells/l ). Results of such comparison are presented in Tablle 4. |
Table 4. Data/Observations comparison ( 2000 )
Runabsolute value normalized
a1cell_2000_a1_new.jpg cell_2000_a1_norm.jpg
a3cell_2000_a3_new.jpg cell_2000_a3_norm.jpg
a5cell_2000_a5_new.jpg cell_2000_a5_norm.jpg
a6cell_2000_a6_new.jpg cell_2000_a6_norm.jpg
a7cell_2000_a7_new.jpg cell_2000_a7_norm.jpg
updated on 04/18/2003
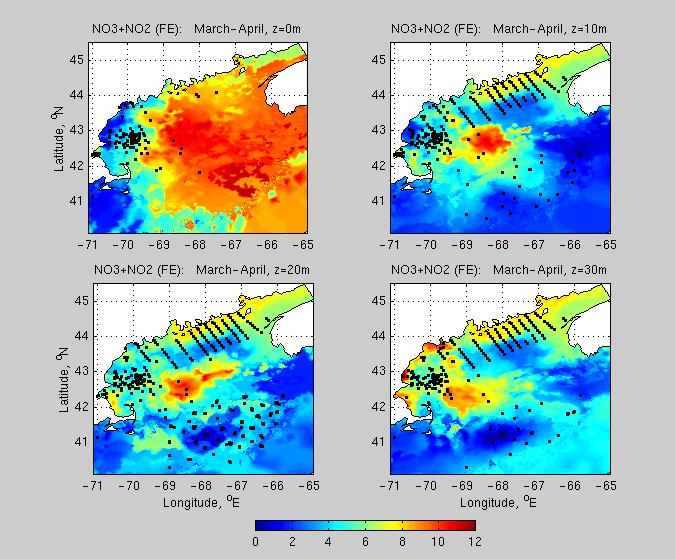
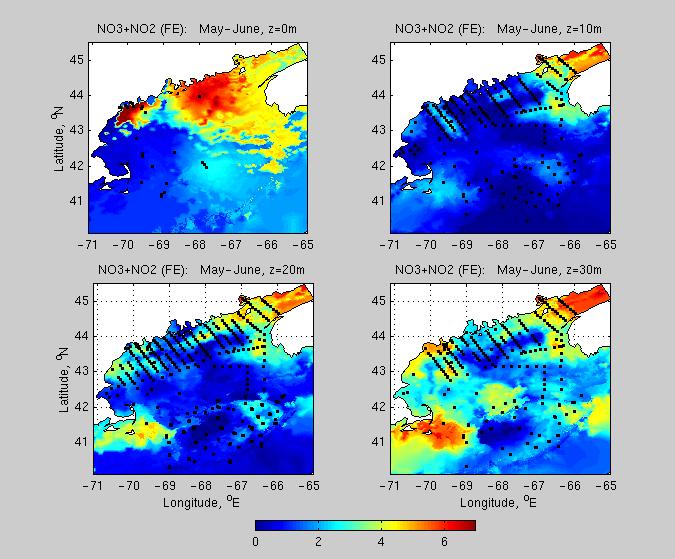
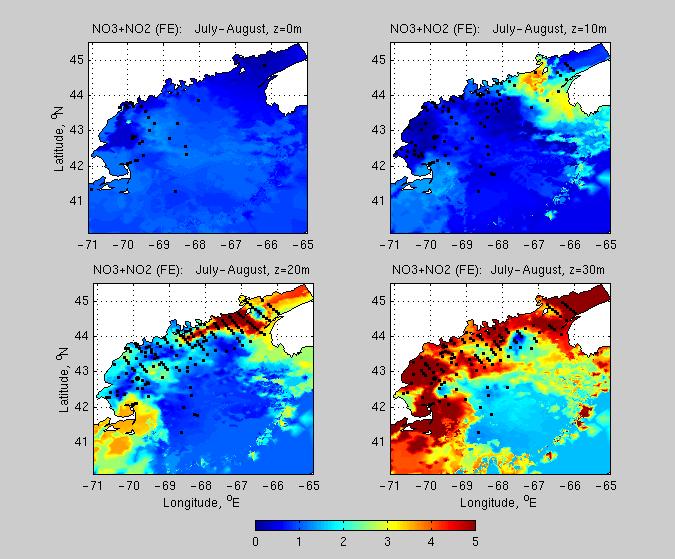
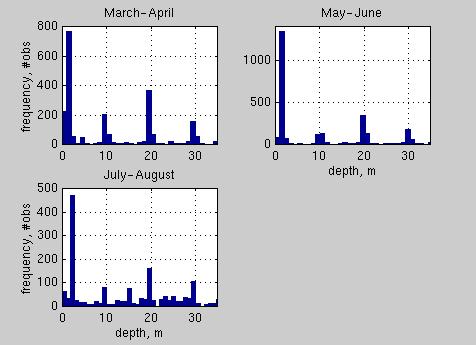
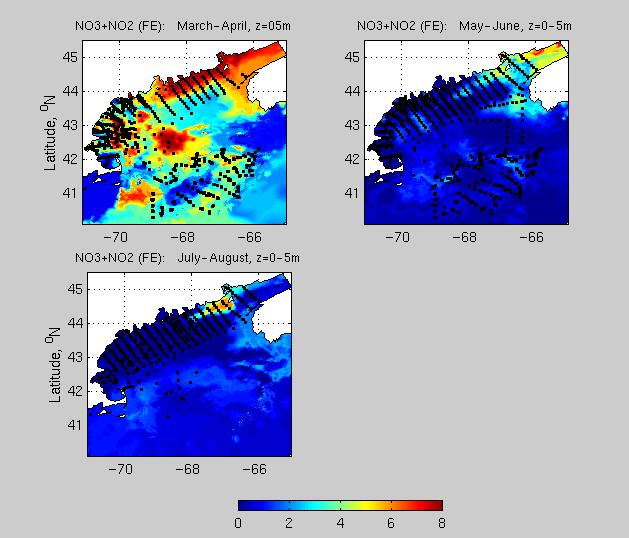
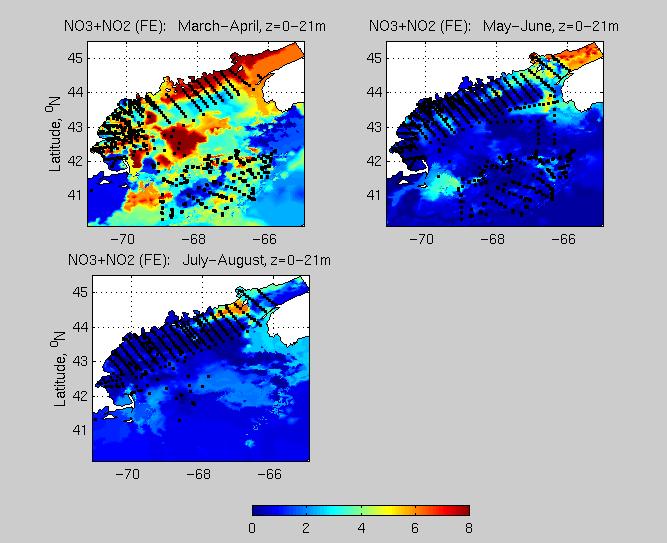
A new set of Gulf of Main observations (1932-2001) is used to get a nutrient distribution in the GOM domain and use it in a model runs with nutrient limitation. First of all, station positions were plotted to see how uniformly stations occupy GOM domain, see plot stations . It is clearly seen that NO3 and NO2 stations located mostly in the western GOM, and the only NO3+NO2 stations occupy the whole GOM domain. So, in further analysis, the only NO3+NO2 data was used. First of all, NO3+NO2 data was grouped in 3 consecutive bi-monthly periods: March-April, May-June, and July-August. Then, to get a horizontal distribution of the nutrient field at depths 0, 10, 20, and 30 m, all data in a depth range +/-1 m were extracted and then projected onto FE mesh "g2s.5b" using OAX procedure. Such distribution for each of the 3 bi-monthly periods displayed in figures MA , MJ , and JA . Unfortunately, there is insufficient data at z=0 m to get robust NO3+NO2 distribution at this level. To get a statistics how observations distributed through the depth, a corresponding histogram displayed in this figure: histogram. Now we can see that the most of the stations on the uppermost layer are distributed through the depth range 0-5 m, and through the depth range +/- 2 m for the rest of the depth levels. Using this statistics, NO3+NO2 distribution at z=0 m was reprocessed and is displayed in figure NO3+NO2_(0m). To get a depth averaged nutrient distribution in Z-layer, all data in a depth range 0-21 m were combined and then OAX processed; corresponding distribution displayed in figure NO3+NO2_(0-21m). Using newly constructed nutrient fields, 6 new runs with nutrient limitation ( a7 is a main run ) were calculated. Corresponding animations may be played using table 5. Runs with the incident solar radiation rad=345 were used just to increase a cell concentration.
Table 5. New runs with nutrient limitation (NO3+NO2 observed)
Runparameters .fli movie data/obs
comparison (1998)
data/obs
comparison (2000)
a7aNO3 (20m); rad=280 cell98_a7a_new.fli cell_1998_a7a.jpg cell_2000_a7a.jpg
a7bNO3 (10m); rad=280 cell98_a7b_new.fli cell_1998_a7b.jpg cell_2000_a7b.jpg
a7cNO3(0-20m); rad=280 cell98_a7c_new.fli cell_1998_a7c.jpg cell_2000_a7c.jpg
a7dNO3(0-20m); rad=345 cell98_a7d_new.fli cell_1998_a7d.jpg cell_2000_a7d.jpg
a7eNO3(10m); rad=345 cell98_a7e_new.fli cell_1998_a7e.jpg cell_2000_a7e.jpg
a7fNO3(0-5m); rad=345 cell98_a7f_new.fli cell_1998_a7f.jpg cell_2000_a7f.jpg updated 05/16/2003
NO3 distribution in the Gulf of Main basin was corrected using a special correcting procedure: - Garside's formulas #2 or #5 were used to get NO3 field from the climatic T & S;
- the "nearest neighbor" algorithm was used to correct NO#3 field: if Sal < 31.3 then NO3 = NO3(nearest).Results of 2 new runs with nutrient limitation and NO3 fields received using formulas #2 and #5, and corrected after that, presented in Table 6. Also, a diagnosis plots are presented here.
Table 6. New runs with nutrient limitation (NO3+NO2 corrected)
Runparameters .fli movie
corrected
not correcteda7_cor2
NO3 climatic, corrected ; #2cell98_a7_new_cor2.fli diag_cor2.jpg diag_ncor2.jpg a7_cor5
NO3 climatic, corrected; #5cell98_a7_new_cor5.fli diag_cor5.jpg diag_ncor5.jpg updated 06/18/2003
Results of 2 new runs with nutrient limitation and corrected/not corrected NO3 field presented in Table 7. NO3 field was first received using Garside's formula # 2, then corrected using Salinity limitation Sal=31.3. No germination. Initial cell concentration is zero everywhere in a basin; cell concentration at the Bay of Fundy northern boundary is 10 cells/liter. Run 3 has been performed using same parameters as run 2 but without nutrient limitation. Table 7. New runs: without germination and with nutrient limitation
Runparameters .fli movie a8_ncor2
NO3 climatic, not corrected ; #2; no germinationcell98_a8_new_ncor2.fli a8_cor2
NO3 climatic, corrected; #2; no germinationcell98_a8_new_cor2.fli a8_cor2_nolim
NO3 climatic, corrected; #2; no germination; no NO3 limitationcell98_a8_new_cor2_nolim.fli updated 07/07/2003
Results of 2 new runs using corrected cysts distribution in case of germination only and nutrient limitation (corrected NO3 field, #2) presented in Table 8. Corrected cysts map displayed here. Initial cell concentration for both runs is zero everywhere in a basin. Table 8. New runs: germination only and nutrient limitation
Runparameters .fli movie a6_fixed
germination onlycell98_a6_new_fixed.fli a7_cor2_fixed germination, growth, mortality, nutrient limitation; NO3 climatic, corrected; #2; cell98_a7_new_cor2_fixed.fli