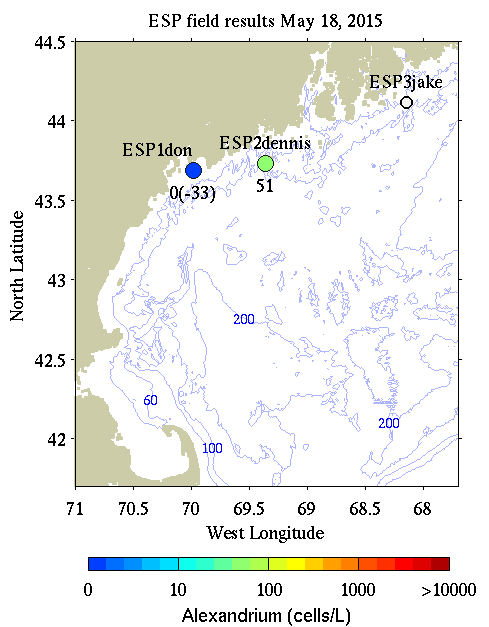
If
no
NA1
spots
were
visually
detected
on
the
array,
then
the
estimate
from
the
array
value
was
plotted
as
<100
(data
point
on
the
baseline)
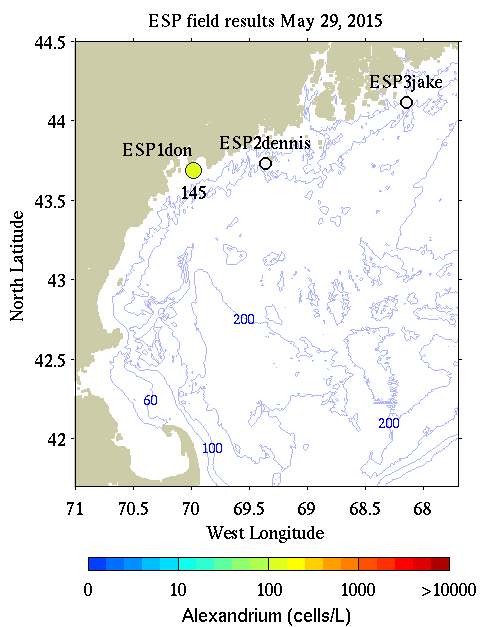
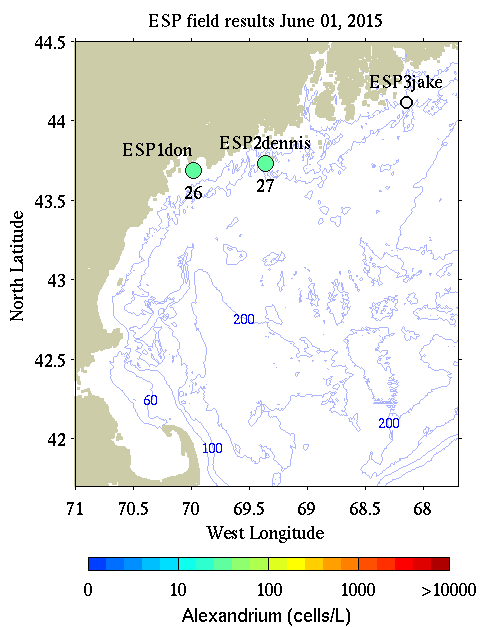
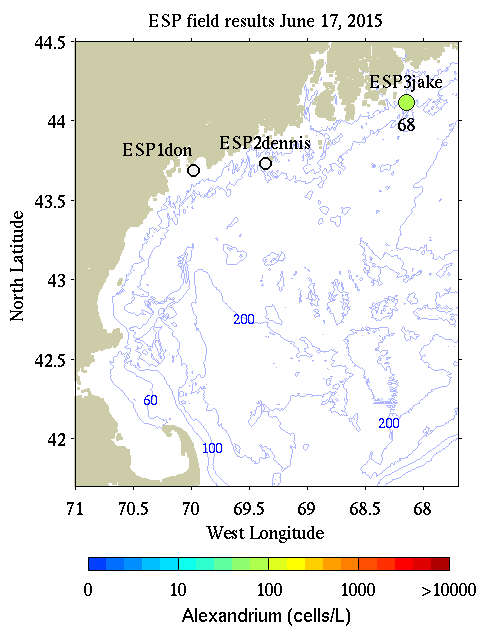
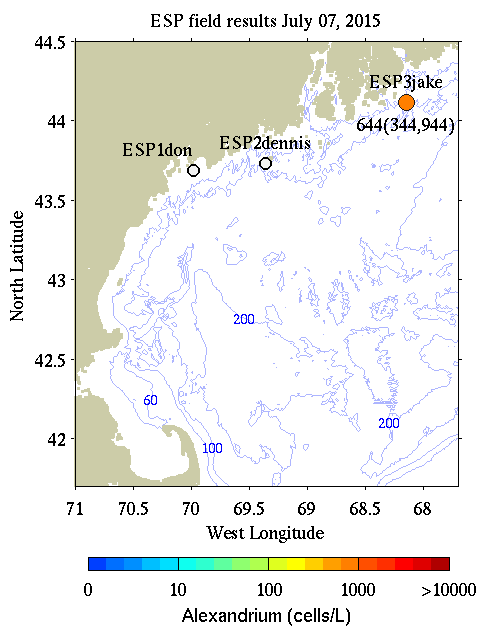
If weak NA1 spots were visually detected and the estimated
value from the array was >0, then that value was plotted as
the actual
value
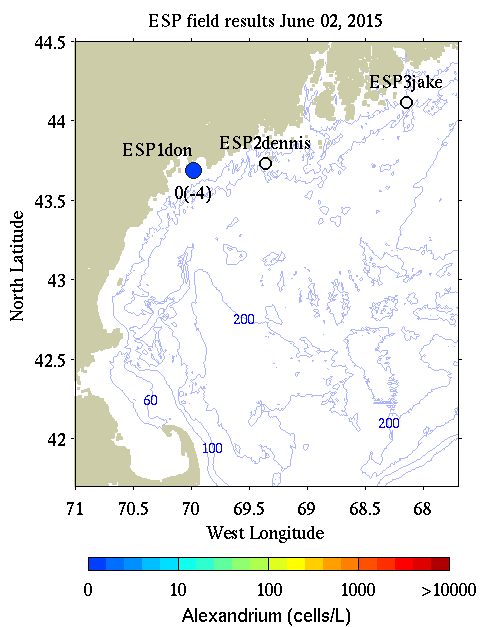
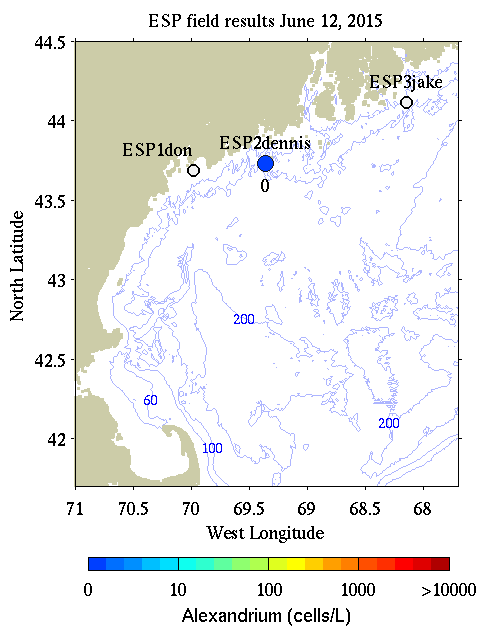
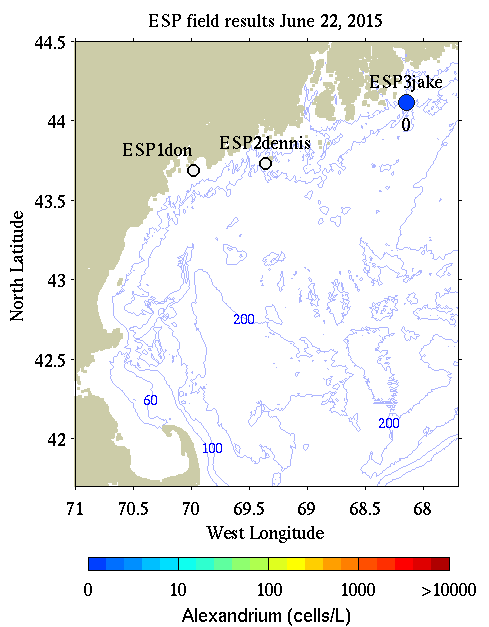
If weak NA1 spots were visually detected and the raw array
value was <0, then that value was plotted as 0 (on baseline
but not <100 as
above)
The grey box indicates that even though weak positive
spots may be present, the estimate of the field population is very low
and considered below the detection limit of ESP @ about 100 cells/L
|
|
|