Updated April 5, 2000.
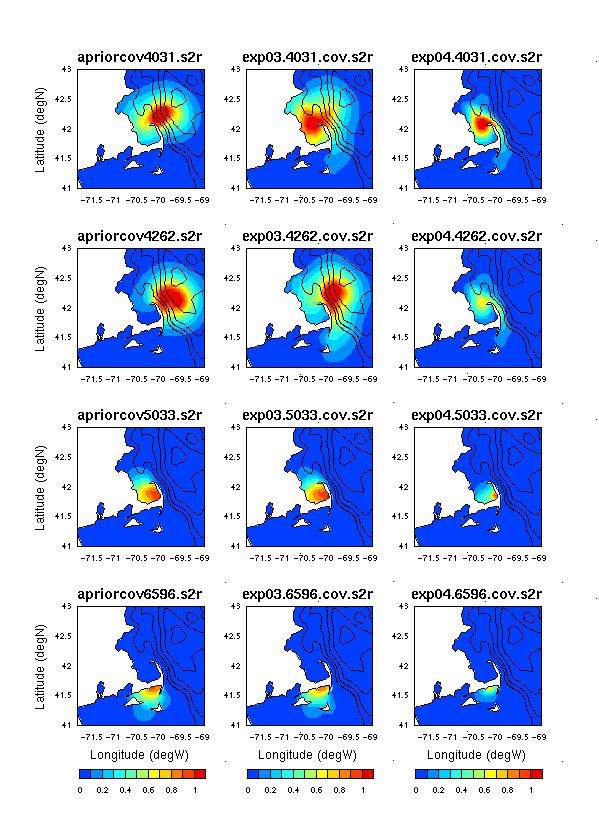
1. Covariance structures for point sources in various locations.
Left column: diff=const, vel=0 [benchmark of DRL result].
Middle column: diff = const, MA climatological velocity
Right column: MA climatological velocity and diffusivity
Ah = const , V = 0
Ah = const, MA V field
MA V , Ah
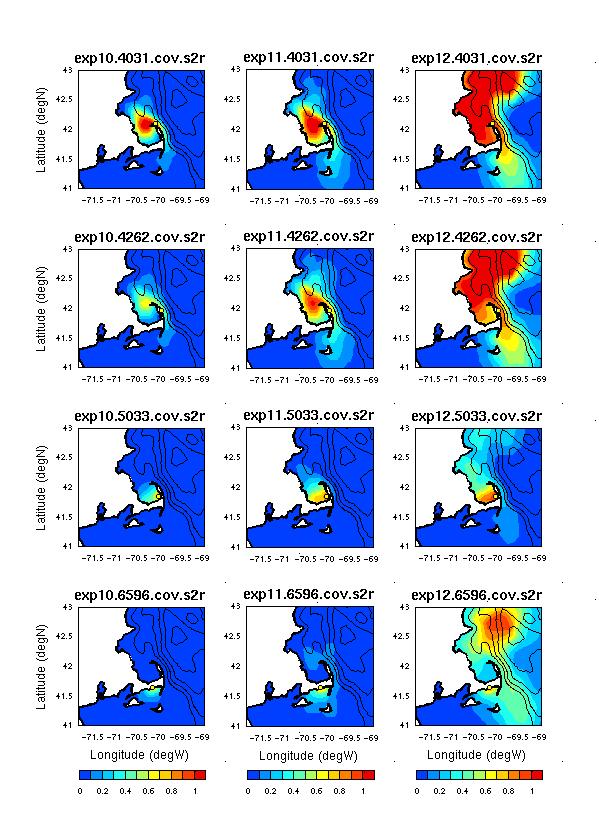
2. Sensitivity of the covariance structure to k^2 scaling.
Left Column: identical to right column above; climatological velocity and
diffusivity
k^2=1.0E-06 scaled globally assuming Ah=500, dx=5000
Middle column: k^2 scaled globally assuming Ah=250, dx=5000
Right column: k^2 scaled locally with the actual diffusivity values
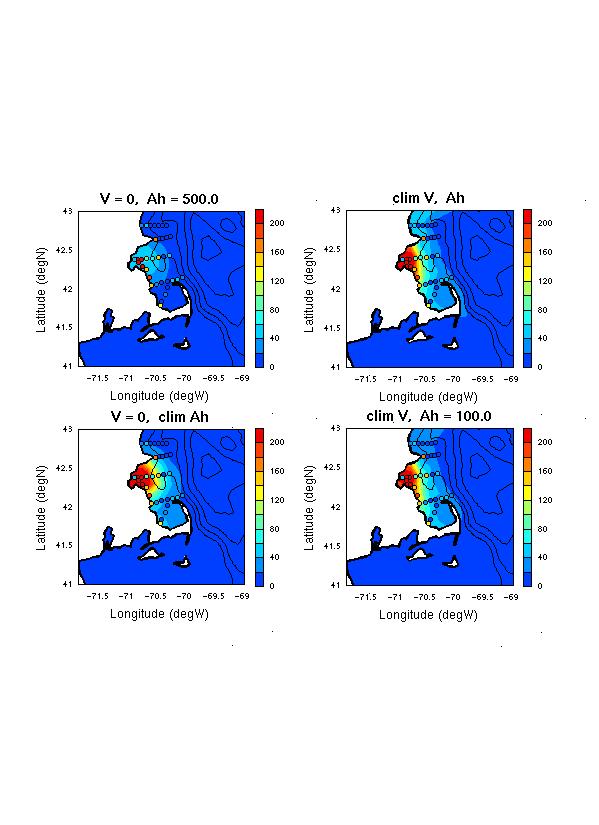
3. Sample OAs using RMRP Alexandrium data.
Analyzed fields shown in color; actual data values shown as colored
dots.
Velocity Diffusivity
Upper left:
0
500.0
Upper right: clim
clim
Lower left: 0
clim
Lower right: clim
100.0
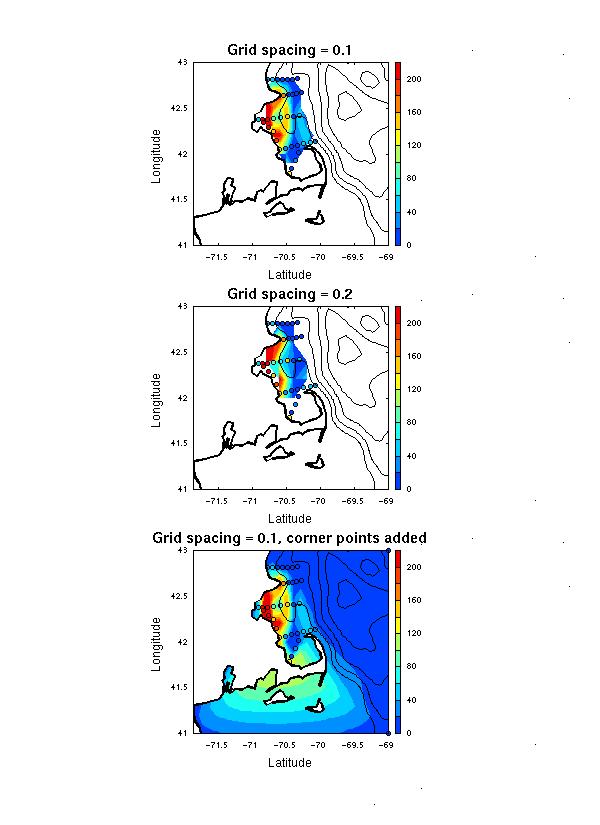
4. Mapping the same data using simple cubic interpolation.
Top: Grid spacing = 0.1 degrees
Middle: Grid spacing = 0.2 degrees
Bottom: Grid spacing = 0.1 degrees, corner points added with zero values
to map out
whole field
Note that in the top two panels, the contouring routing automatically
blanks the
field beyond the data.
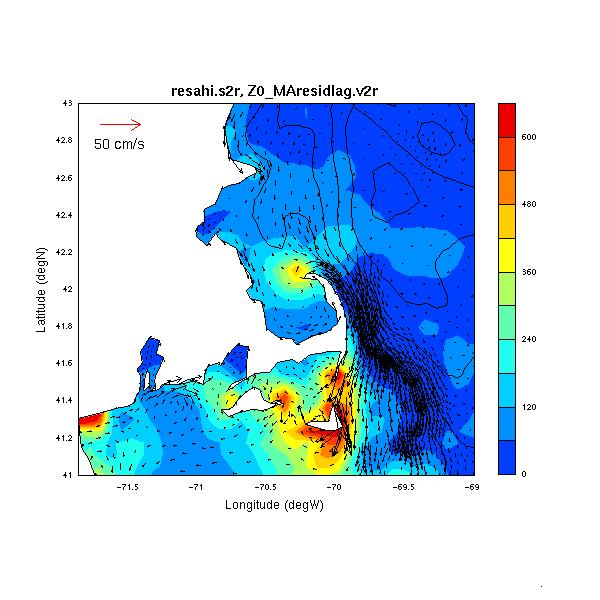
5. Transport fields: velocity vectors overlayed on diffusivity (MA
climatology).