Dennis J. McGillicuddy, Jr., Donald M. Anderson, Andrew Solow
(Woods Hole Oceanographic Institution)
Daniel R. Lynch (Dartmouth College)
David Townsend (University of Maine)
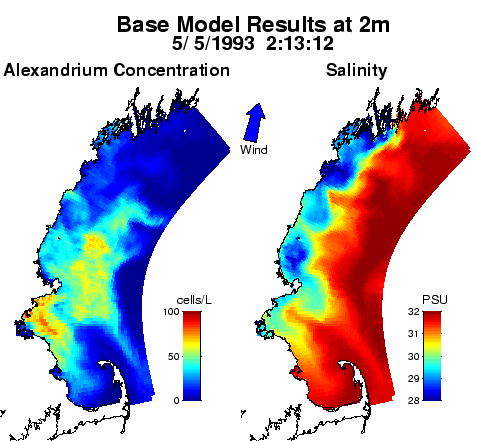
1) Animated model
output [Section E.2.2]
fli
format (view with aaplay/aawin [Windows], quictime (Mac), or
xanim [unix])
avi
format (view with Windows media player)
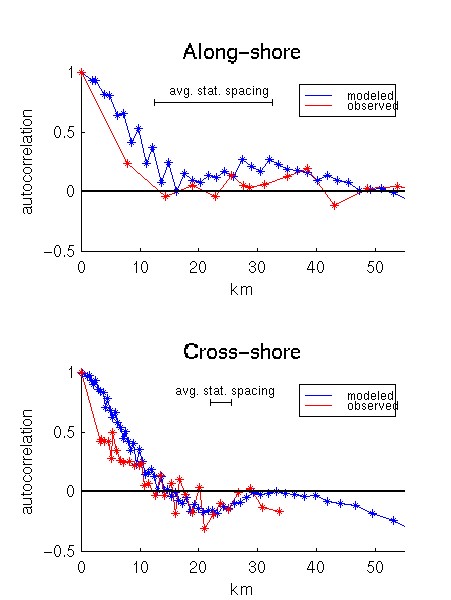
2) Autocorrelation plots for Alexandrium cell concentration data [Section E.2.2]
The observations clearly contain patchiness at small scales that is
not resolved
in the model simulations. This is illustrated in the following
two figures, which
show the autocorrelation functions for the simulated and observed cell
distributions
in the alongshore and cross-shore directions. These plots indicate
the degree to
which cell concentration at a particular point is correlated with concentrations
at
neighboring points as a function of separation distance.
The fact that this correlation falls of more rapidly in the observations
than in the
model suggests that the model fields are smoother than the observations,
and thus
do not fully resolve the patchiness contained in the observations.
Also note that the average station spacing in the cross shore direction
is such that
neighboring observations are fairly well correlated with each other.
This is not true
in the alongshore direction, where adjacent transects are essentially
uncorrelated with
each other.
3) Table of proposed workshop participants [Sections E.4.5 and E.5]
in PDF format.
Workshop Table
4)
Supporting letters [Section E.8] in PDF format.
Signatures have been removed for security reasons; originals are on file at WHOI.
Paul Anderson, Maine
Sea Grant
Philip Bogden, GoMOOS
Michael Hickey, Massachusetts
Division of Marine Fisheries
John Hurst, Maine
Department of Marine Resources
Jennifer Martin, Fisheries and Oceans, Canada
Linda Mercer, Maine
Department of Marine Resources
Michael Mickelson, Massachusetts Water Resources Authority
Grayson Wood, NOAA CoastWatch
Contact: dmcgillicuddy@whoi.edu