PRISM: Processes Regulating Iron Supply at the Mesoscale in the Ross Sea


                           VPR tow parameters:

                                               track--lat/lon  ship's  track, Fluor-- fluorescence, Obs-- Optical backscattering,  Par--photosyntetically active radiation, Rho--density

                           VPR file column headings:

                                                1  vpr timestep
                                                2  gmt in hhmmss.sss

                                                3  date in ddmmyy         

                                                4  latitude in ddmm.mmmm. From ship GPS, negative values are Western hemisphere            
                                                5  longitude in ddmm.mmmm. From ship GPS), negative values are Southern hemisphere
                                                6  bottom depth
                                                7  alt 
 
                                              8 roll           Roll angle, (degrees, positive: roll to right?)
                                                9 pitch          Pitch angle, (degrees, positive up)  
                                                10  flow                                                    
                                                11  fluorescence   ug Chl-a/liter              
                                                12 PAR            Downwelling light from PAR sensor, micro Einsteins/cm2/sec       
                                                13  turbidity      Optical backscatter (Formazin turbidity units)
                                                14  salinity       Salinity (unitless~=PSU and o/oo) from VPR CTD                   
                                                15  temperature    Temperature of seawater in oC from VPR CTD                               
                                                16  vprdepth                                  

                                  Table 1. VPR tows from cruise NBP1201. Physical parameters and taxon groups (png plots).
   Date/vpr tow
 vpr track/taxon 1
 Fluor/taxon 2
 OBS/taxon 3
 Par/taxon 4
 Rho/taxon 5
 Sal/taxon 6
   Temp
   24-Dec-2011
  12242259.y11
         track        Fluor         Obs         Par        Rho     Salinity   Temperature
         --------
         --------  no taxon data
         --------          --------          --------

   25-Dec-2011
  12250104.y11
         track        Fluor         Obs         Par        Rho     Salinity   Temperature
       --------          --------  no taxon data          --------          --------          --------

   01-Jan-2012
  01011850.y12
         track        Fluor         Obs         Par        Rho     Salinity   Temperature
        'blurry'     'marSnow'      'phaeIndiv'     'phaeMany'     'squashed'    'whiteout'    VPR 1


   02-Jan-2012
  01020536.y12
         track        Fluor         Obs         Par        Rho     Salinity   Temperature
        'blurry'     'marSnow'      'phaeIndiv'     'phaeMany'     'squashed'    'whiteout'    VPR 2
      Emily's data      blurry_marSnow       phae2all       phaeIndiv      phaeMany      squashed     whiteout

   03-Jan-2012
  01030717.y12
         track        Fluor         Obs         Par        Rho     Salinity   Temperature
        'blurry'     'marSnow'      'phaeIndiv'     'phaeMany'     'squashed'    'whiteout'    VPR 2

   10-Jan-2012
  01101158.y12
         track        Fluor         Obs         Par        Rho     Salinity   Temperature
        'blurry'     'marSnow'      'phaeIndiv'     'phaeMany'     'squashed'    'whiteout'    VPR 3
      Emily's data      blurry_marSnow       phae2all       phaeIndiv      phaeMany      squashed     whiteout

    14-Jan-2013
     vpr4.y12
         track        Fluor         Obs         Par        Rho     Salinity  Temperature
        'blurry'     'marSnow'      'phaeIndiv'     'phaeMany'     'squashed'    'whiteout'    VPR 4
      Emily's data      blurry_marSnow       phae2all       phaeIndiv      phaeMany      squashed     whiteout
Taxa/TS plot (abs)^
        'blurry'      'marSnow'      'phaeIndiv'     'phaeMany'     'squashed'    'whiteout'   TS plot
Taxa/TS plot (norm)^^         'blurry'      'marSnow'      'phaeIndiv'     'phaeMany'     'squashed'    'whiteout'   TS plot

   16-Jan-2012
   01160701.y12
         track
       Fluor
         Obs
      Par
        Rho
     Salinity
   Temperature
       'blurry'
      'marSnow'
     'phaeIndiv'
  'phaeMany'
    'squashed'
   'whiteout'
     VPR 5
      Emily's data      blurry_marSnow       phae2all       phaeIndiv      phaeMany      squashed     whiteout

   16-Jan-2012
   01162222.y12
         track        Fluor          Obs          Par         Rho      Salinity  Temperature
        'blurry'     'marSnow'      'phaeIndiv'   'phaeMany'     'squashed'    'whiteout'      VPR 6
      Emily's data      blurry_marSnow       phae2all       phaeIndiv      phaeMany      squashed     whiteout

    18-Jan-2012
    01180038.y12
         track
       Fluor
        Obs
        Par
       Rho
    Salinity
  Temperature
        'blurry'
     'marSnow'
     'phaeIndiv'
    'phaeMany'
    'squashed'
   'whiteout'
     VPR 7
      Emily's data      blurry_marSnow       phae2all       phaeIndiv      phaeMany      squashed     whiteout

    19-Jan-2013
  01191223.y12
        track
      Fluor
       Obs
       Par
      Rho
   Salinity
 Temperature
        'blurry'     'marSnow'     'phaeIndiv'     'phaeMany'    'squashed'    'whiteout'    VPR 8
      Emily's data
     blurry_marSnow
      phae2all
     phaeIndiv
     phaeMany
    squashed
   whiteout


    25-Jan-2012
    01250411.y12
         track        Fluor         Obs         Par        Rho     Salinity   Temperature
        'blurry'      'marSnow'      'phaeIndiv'     'phaeMany'     'squashed'    'whiteout'
    VPR 9
      Emily's data      blurry_marSnow       phae2all       phaeIndiv      phaeMany      squashed     whiteout
 Taxa/TS plot (abs)^
        'blurry'
     'marSnow'    'phaeIndiv'   'phaeMany'     'squashed'    'whiteout'    TS plot
 Taxa/TS plot (norm)^^         'blurry'      'marSnow'    'phaeIndiv' 'phaeMany'     'squashed'    'whiteout'    TS plot


    26-Jan-2012
    01262302.y12
         track        Fluor         Obs         Par        Rho     Salinity   Temperature
        'blurry'     'marSnow'      'phaeIndiv'     'phaeMany'     'squashed'    'whiteout'     VPR 10
      Emily's data      blurry_marSnow       phae2all       phaeIndiv      phaeMany      squashed     whiteout

    01-Feb-2012
    02010005.y12
         track        Fluor         Obs         Par        Rho     Salinity   Temperature
        'blurry'     'marSnow'      'phaeIndiv'     'phaeMany'     'squashed'    'whiteout'    VPR 11
      Emily's data      blurry_marSnow       phae2all       phaeIndiv      phaeMany      squashed     whiteout

   03-Feb-2012
   02030110.y12
         track        Fluor         Obs         Par        Rho     Salinity   Temperature
        'blurry'     'marSnow'      'phaeIndiv'     'phaeMany'     'squashed'    'whiteout'    VPR 12
      Emily's data      blurry_marSnow       phae2all       phaeIndiv      phaeMany      squashed     whiteout

   03-Feb-2012
   02031551.y12
         track        Fluor         Obs         Par        Rho     Salinity   Temperature
        'blurry'     'marSnow'      'phaeIndiv'     'phaeMany'     'squashed'    'whiteout'    VPR 13
      Emily's data      blurry_marSnow       phae2all       phaeIndiv      phaeMany      squashed     whiteout

   05-Feb-2012
  02050247.y12
         track        Fluor         Obs         Par        Rho     Salinity   Temperature
        'blurry'     'marSnow'      'phaeIndiv'     'phaeMany'     'squashed'    'whiteout'    VPR 14

   05-Feb-2012
   02050826.y12
         track        Fluor         Obs         Par        Rho     Salinity   Temperature
        'blurry'     'marSnow'      'phaeIndiv'     'phaeMany'     'squashed'    'whiteout'    VPR 14_15
      Emily's data      blurry_marSnow       phae2all       phaeIndiv
     phaeMany      squashed
    whiteout

      Composite
   Jan 3 -- Feb 5  2012
         track
        Fluor
        Obs
        Par
       Rho
    Salinity
  Temperature
        'blurry'
    'marSnow'
    'phaeIndiv'
     'phaeMany'
    'squashed'
    'whiteout'
    VPR 3_15
        log10 scale

     'phaeIndiv(log)
   'phaeMany' (log)


      Emily's data       blurry_marSnow
      phae2all
          phaeIndiv
        phaeMany
     squashed
     whiteout

                                                       Note: ^ absolute frequency of TS pairs
                                                                ^^ frequency normalized by total number of TS pairs

                                               
           Table 2. VPR log  from cruise NBP1201
 Dates       Tow ID             Comments
Jan 1           
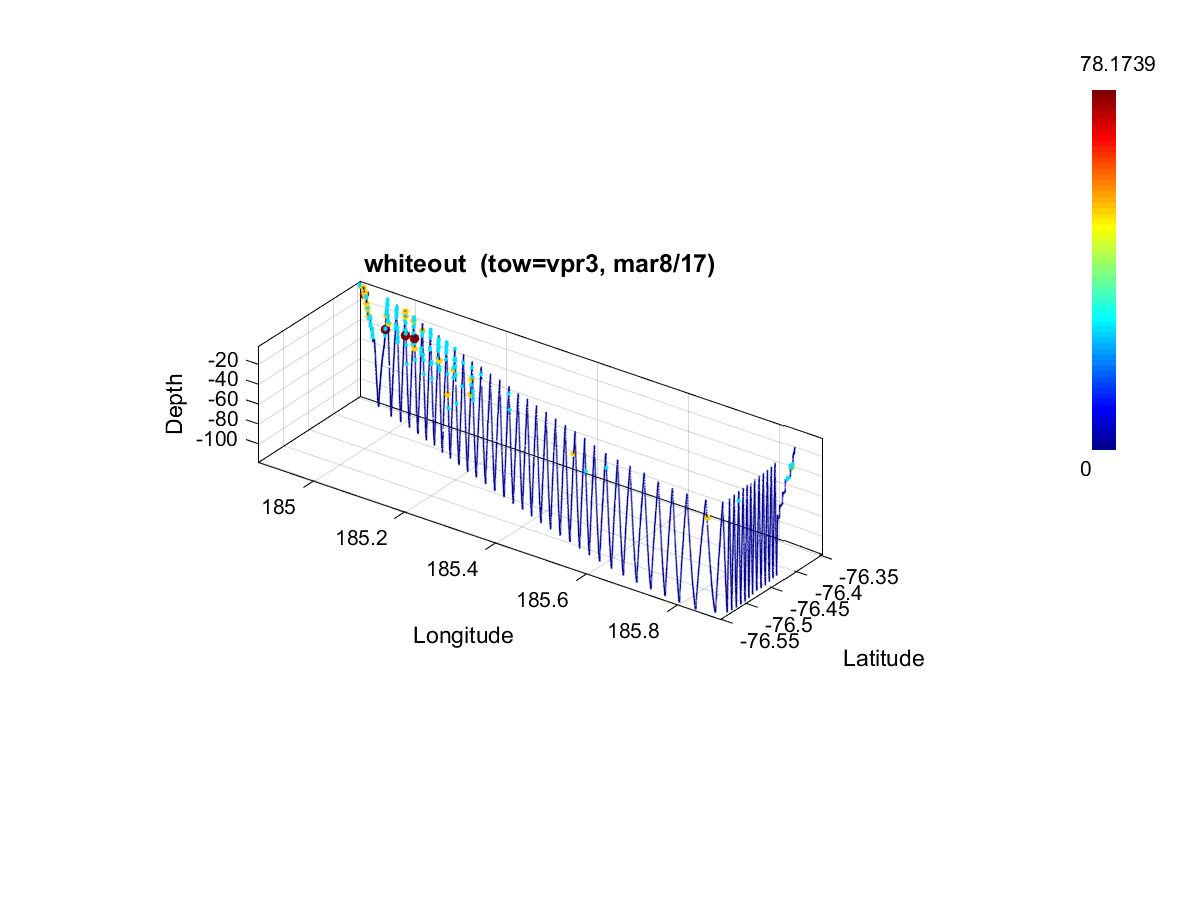
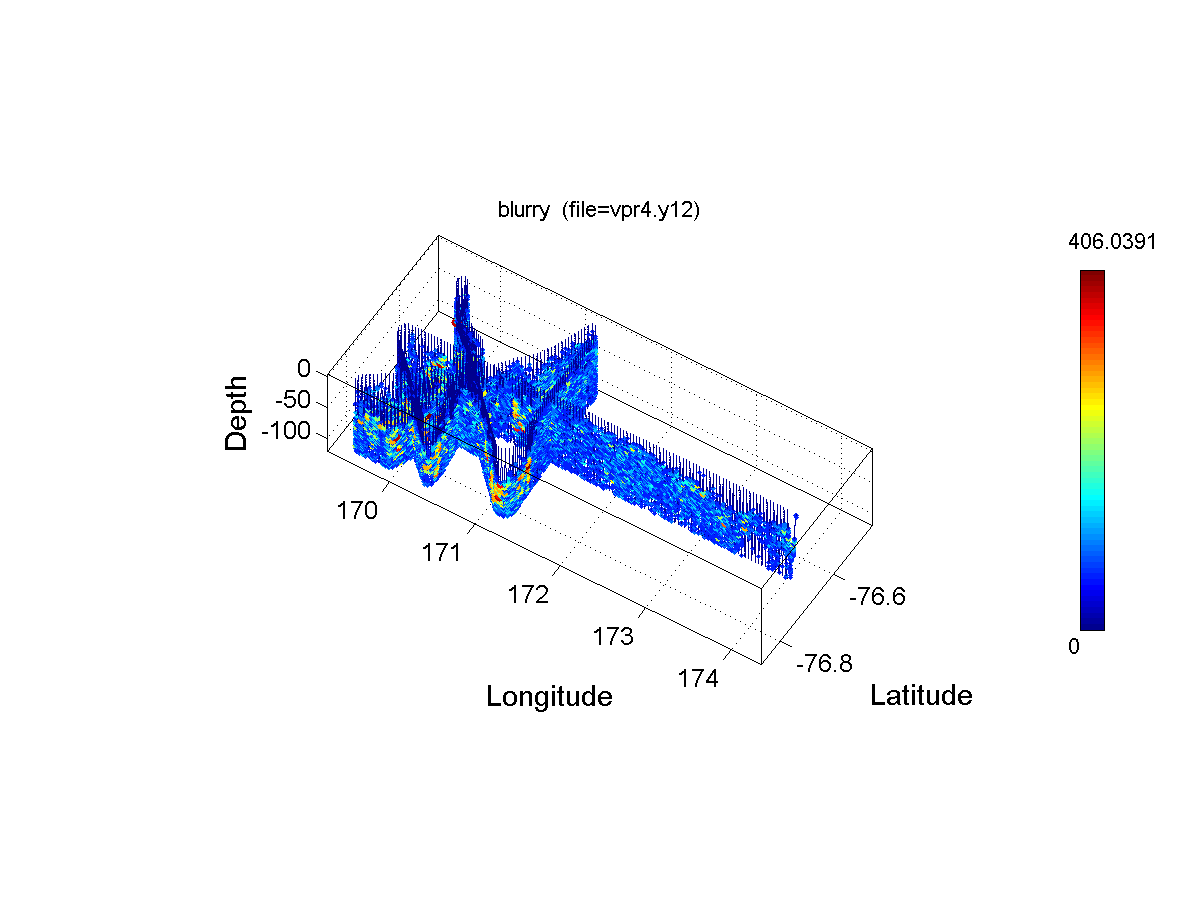
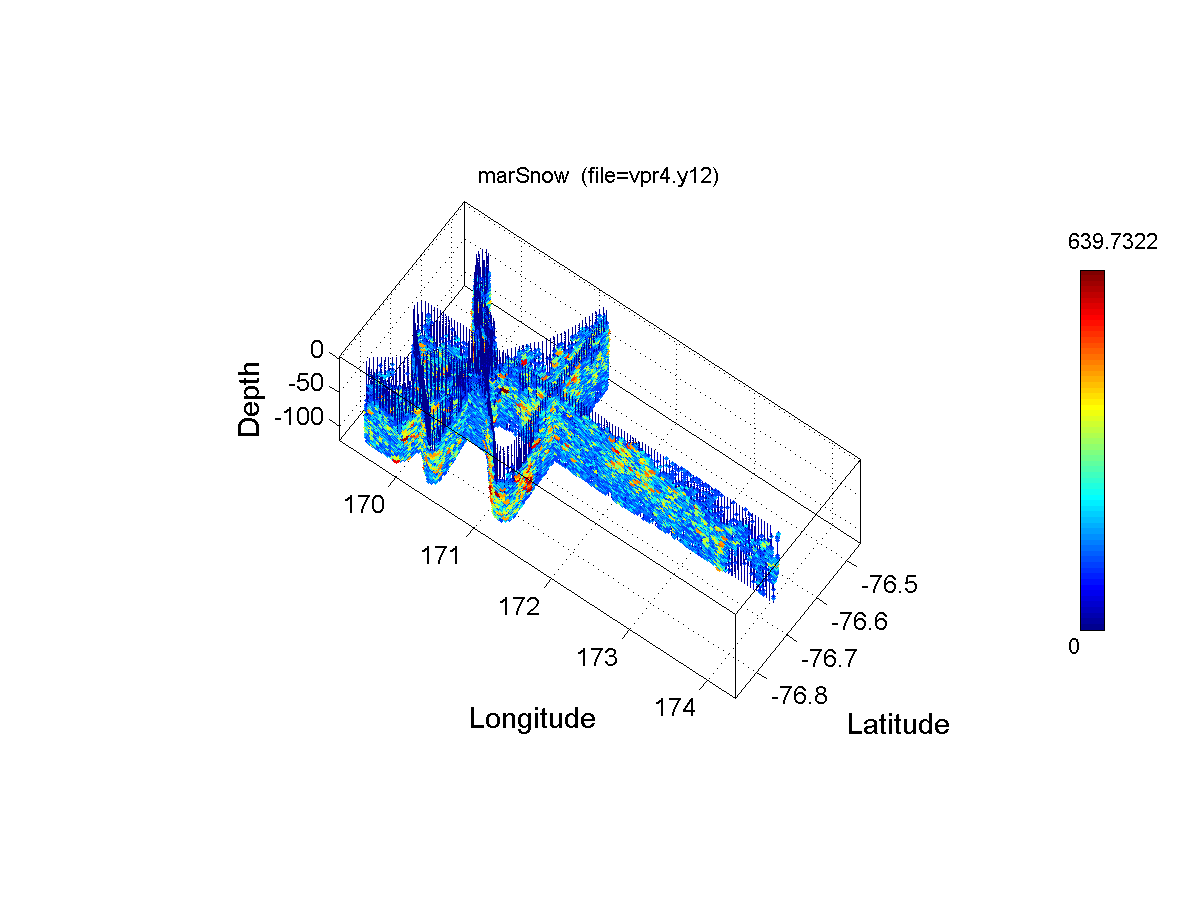
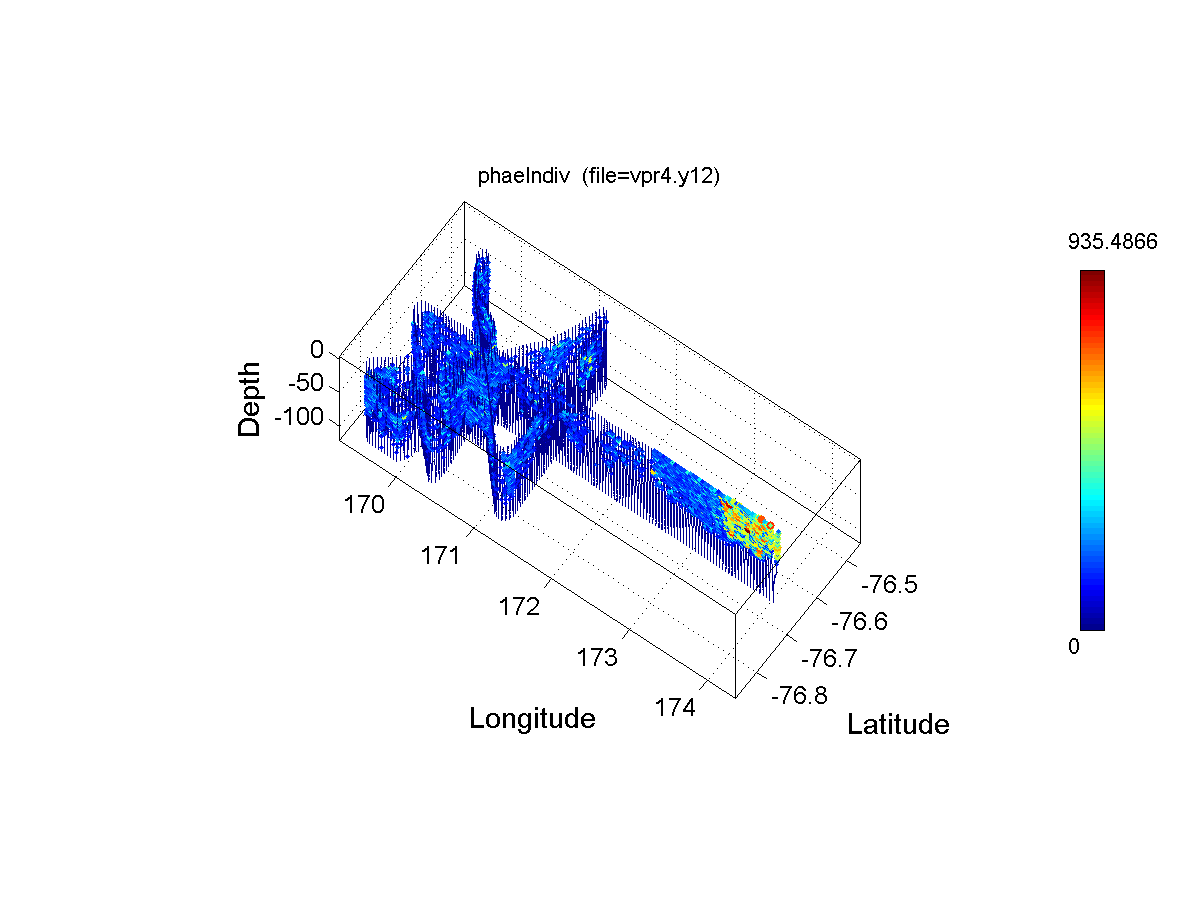
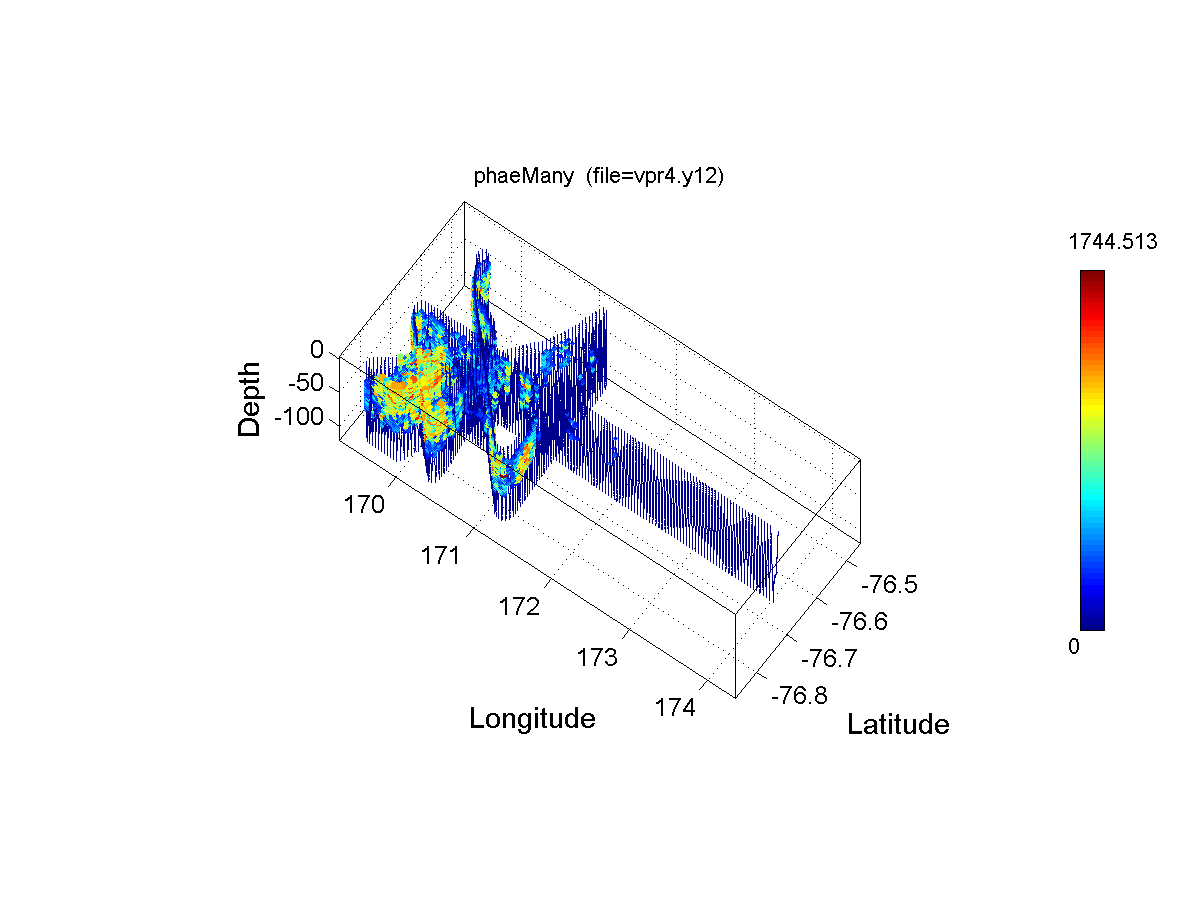
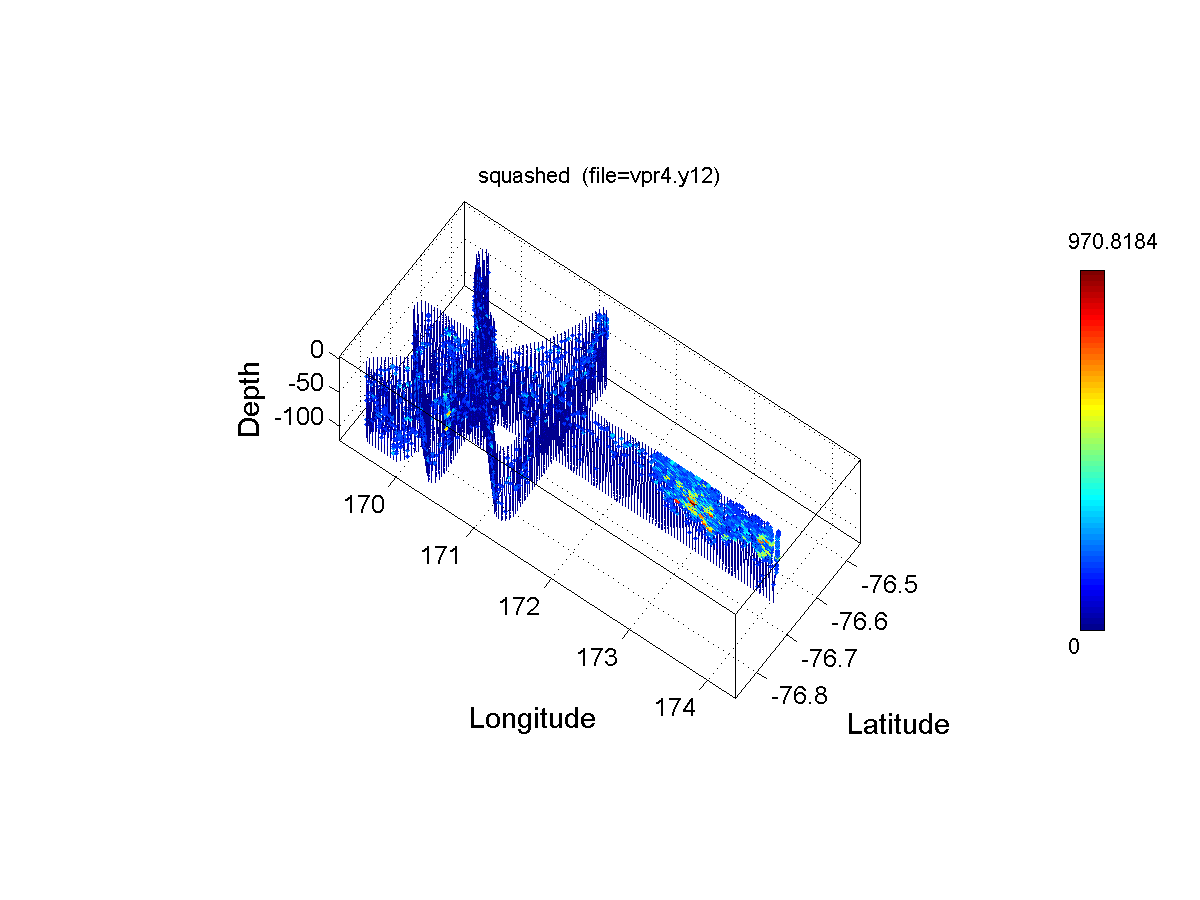
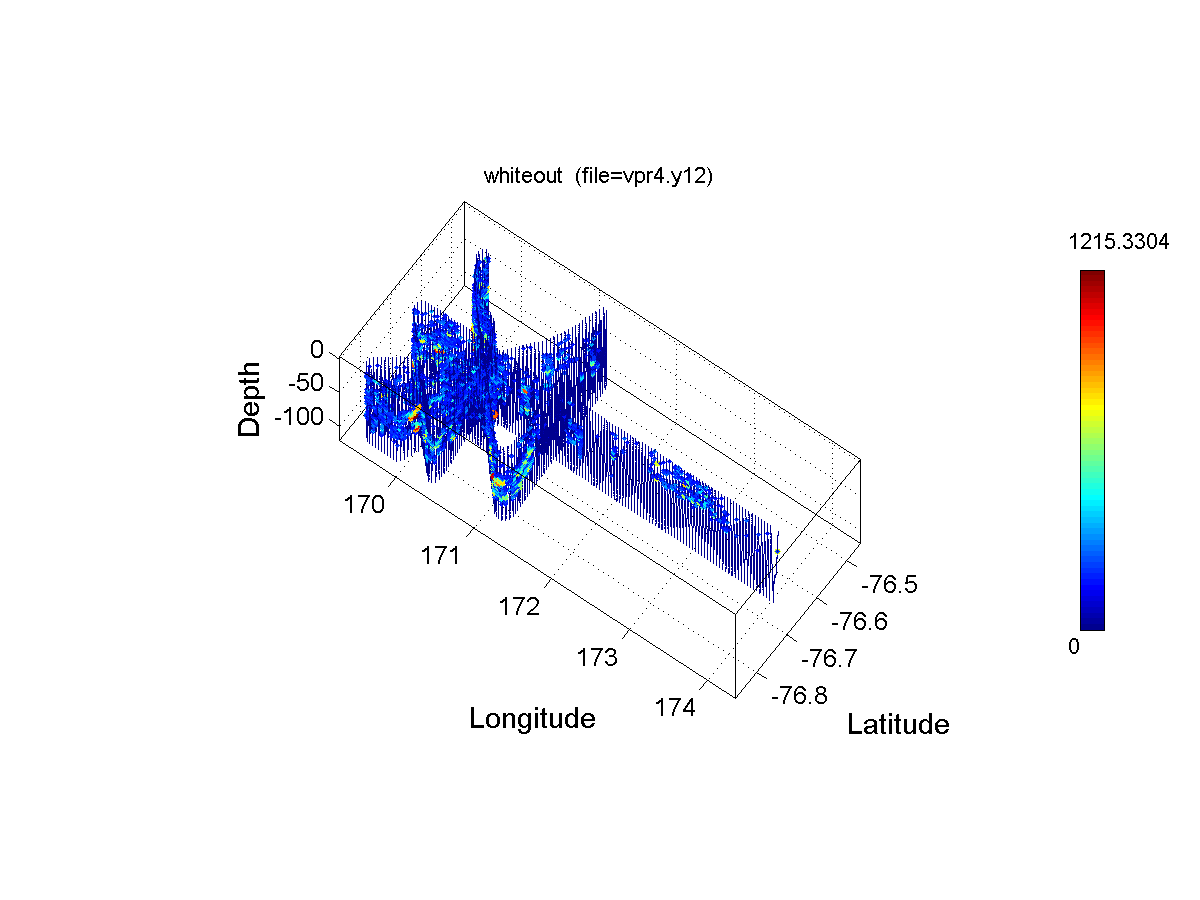
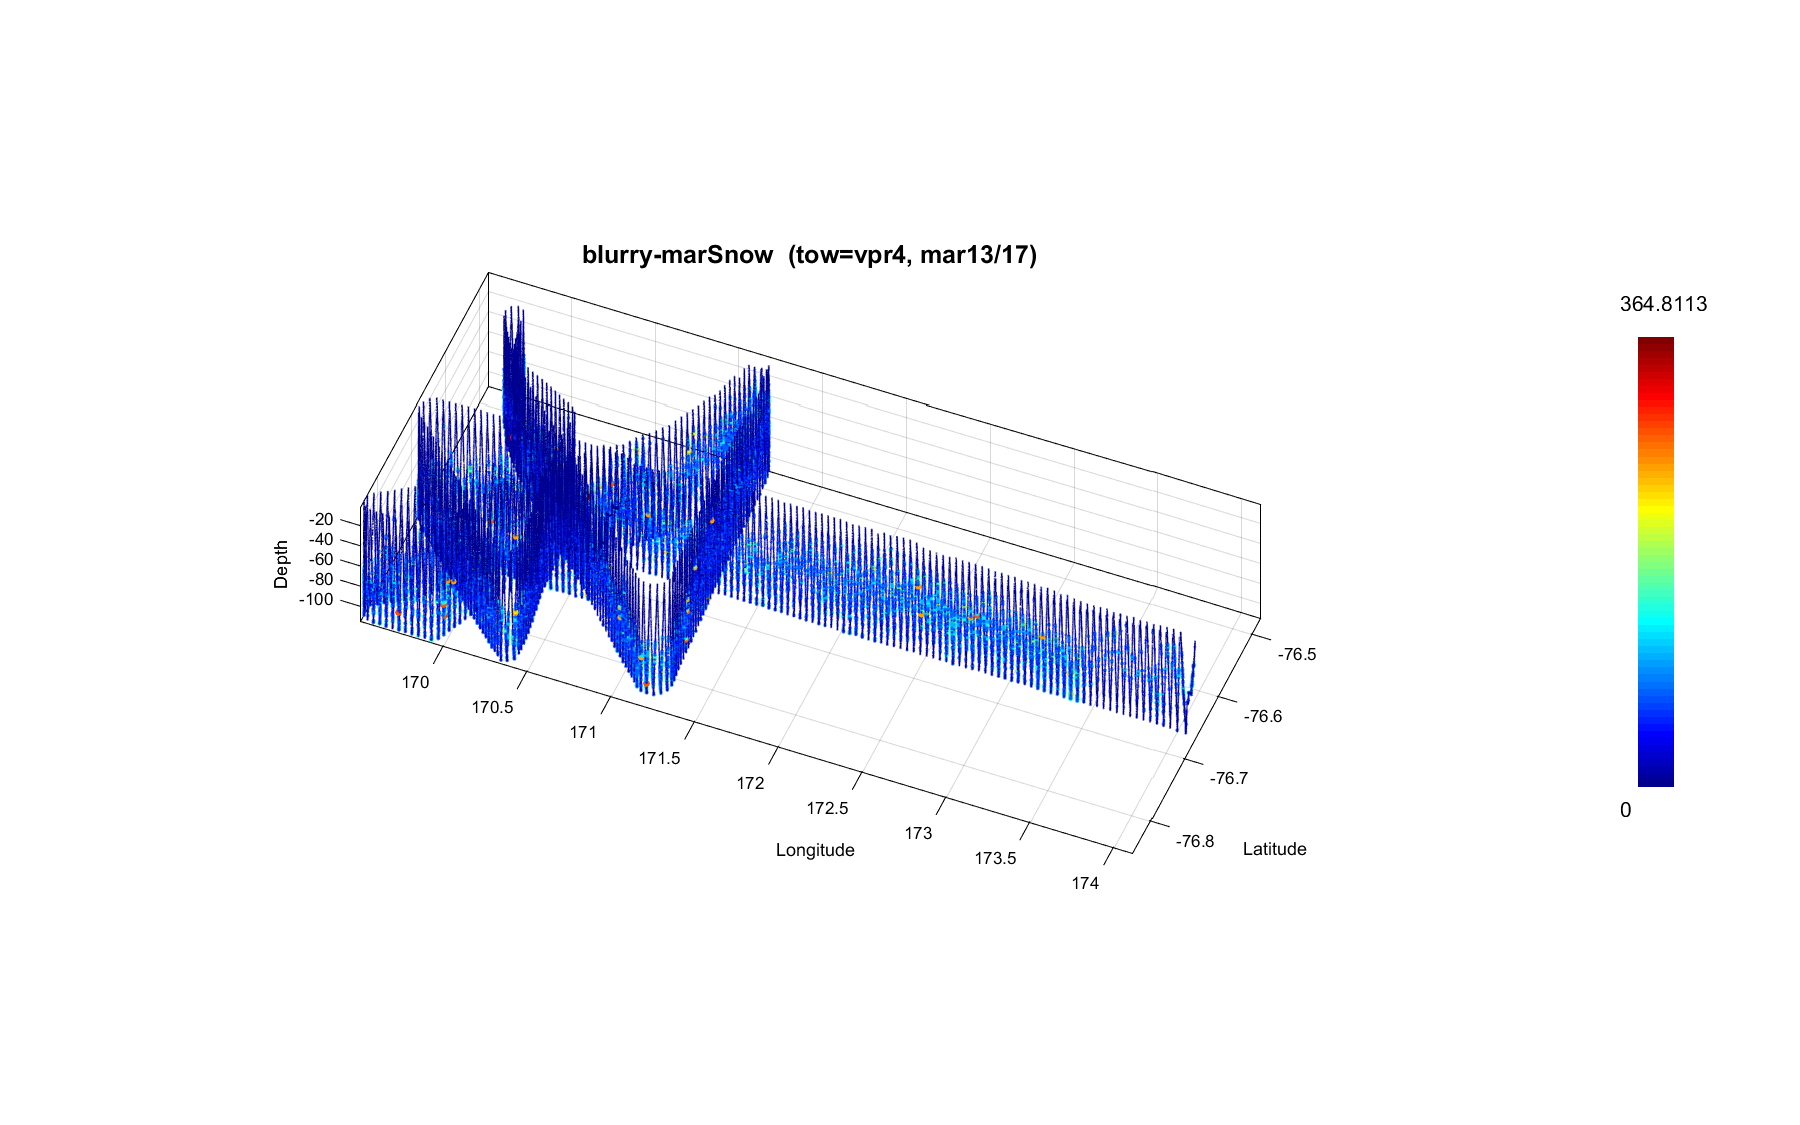
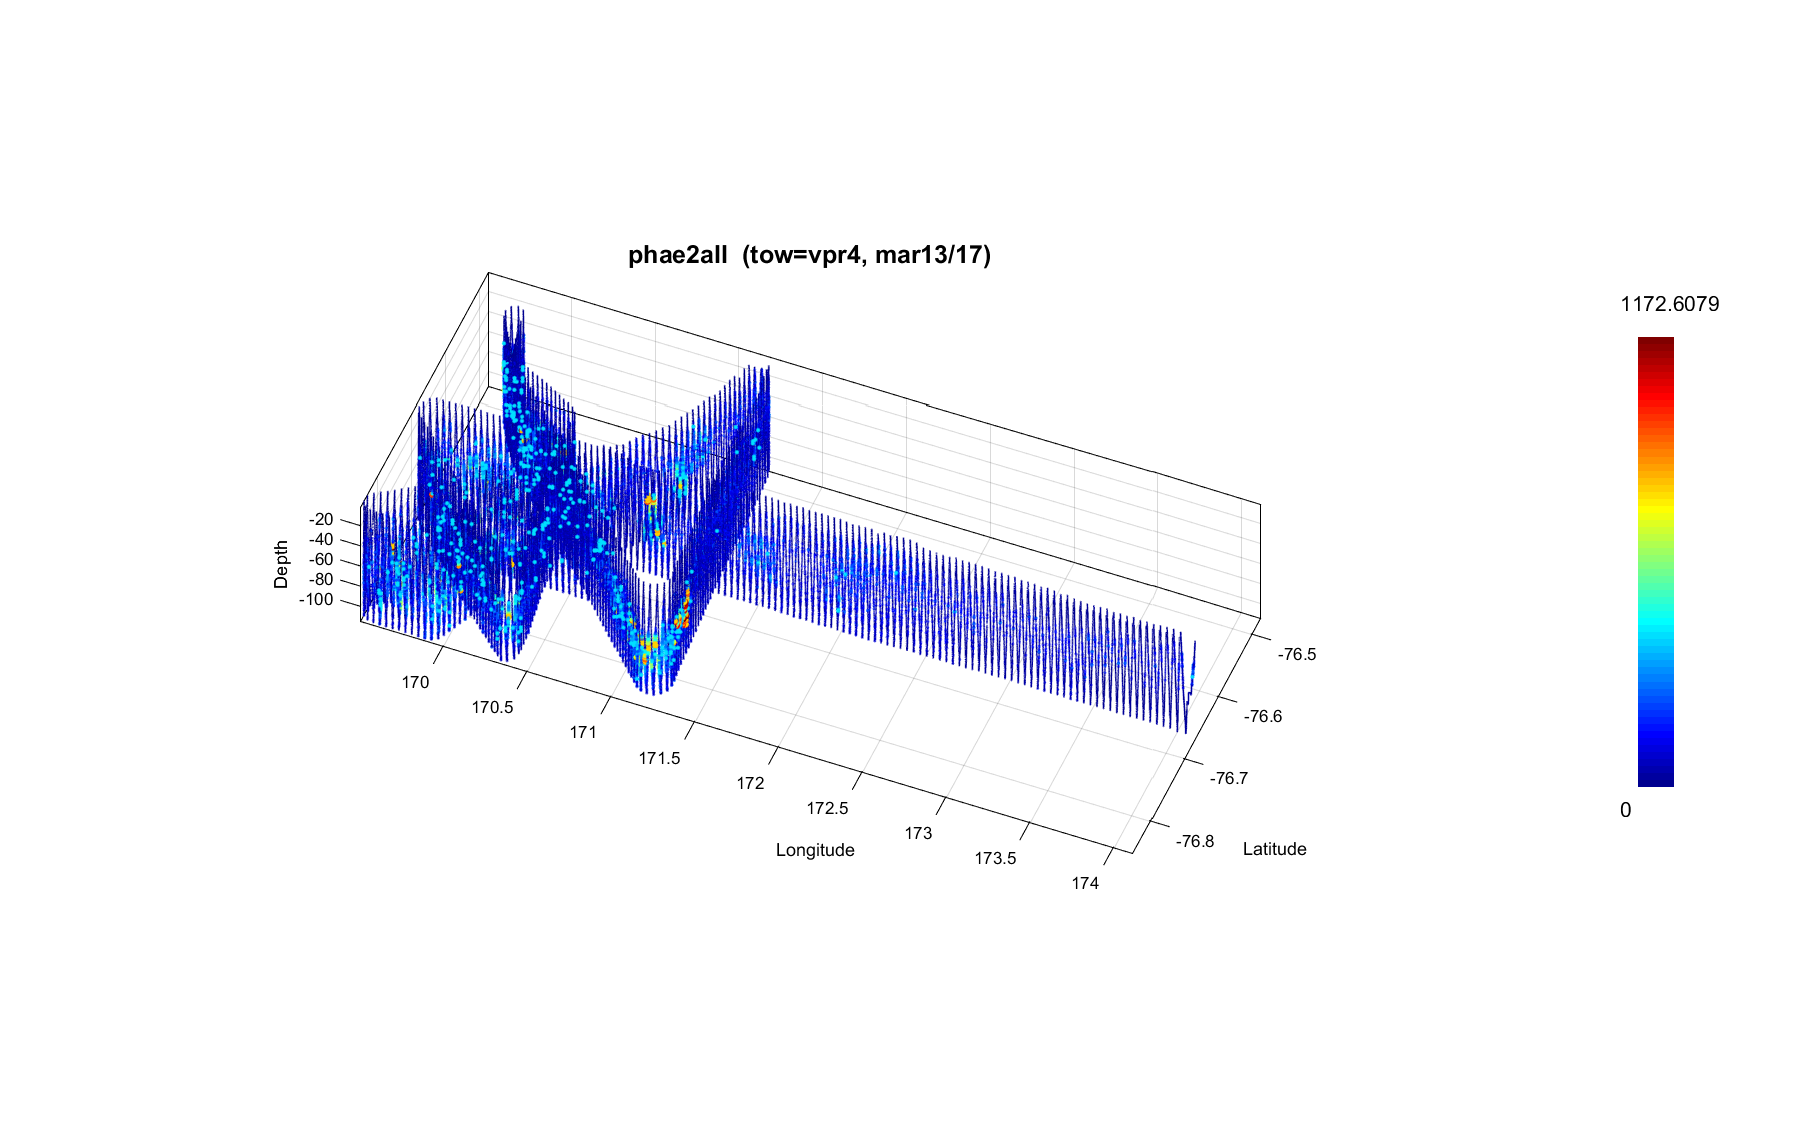
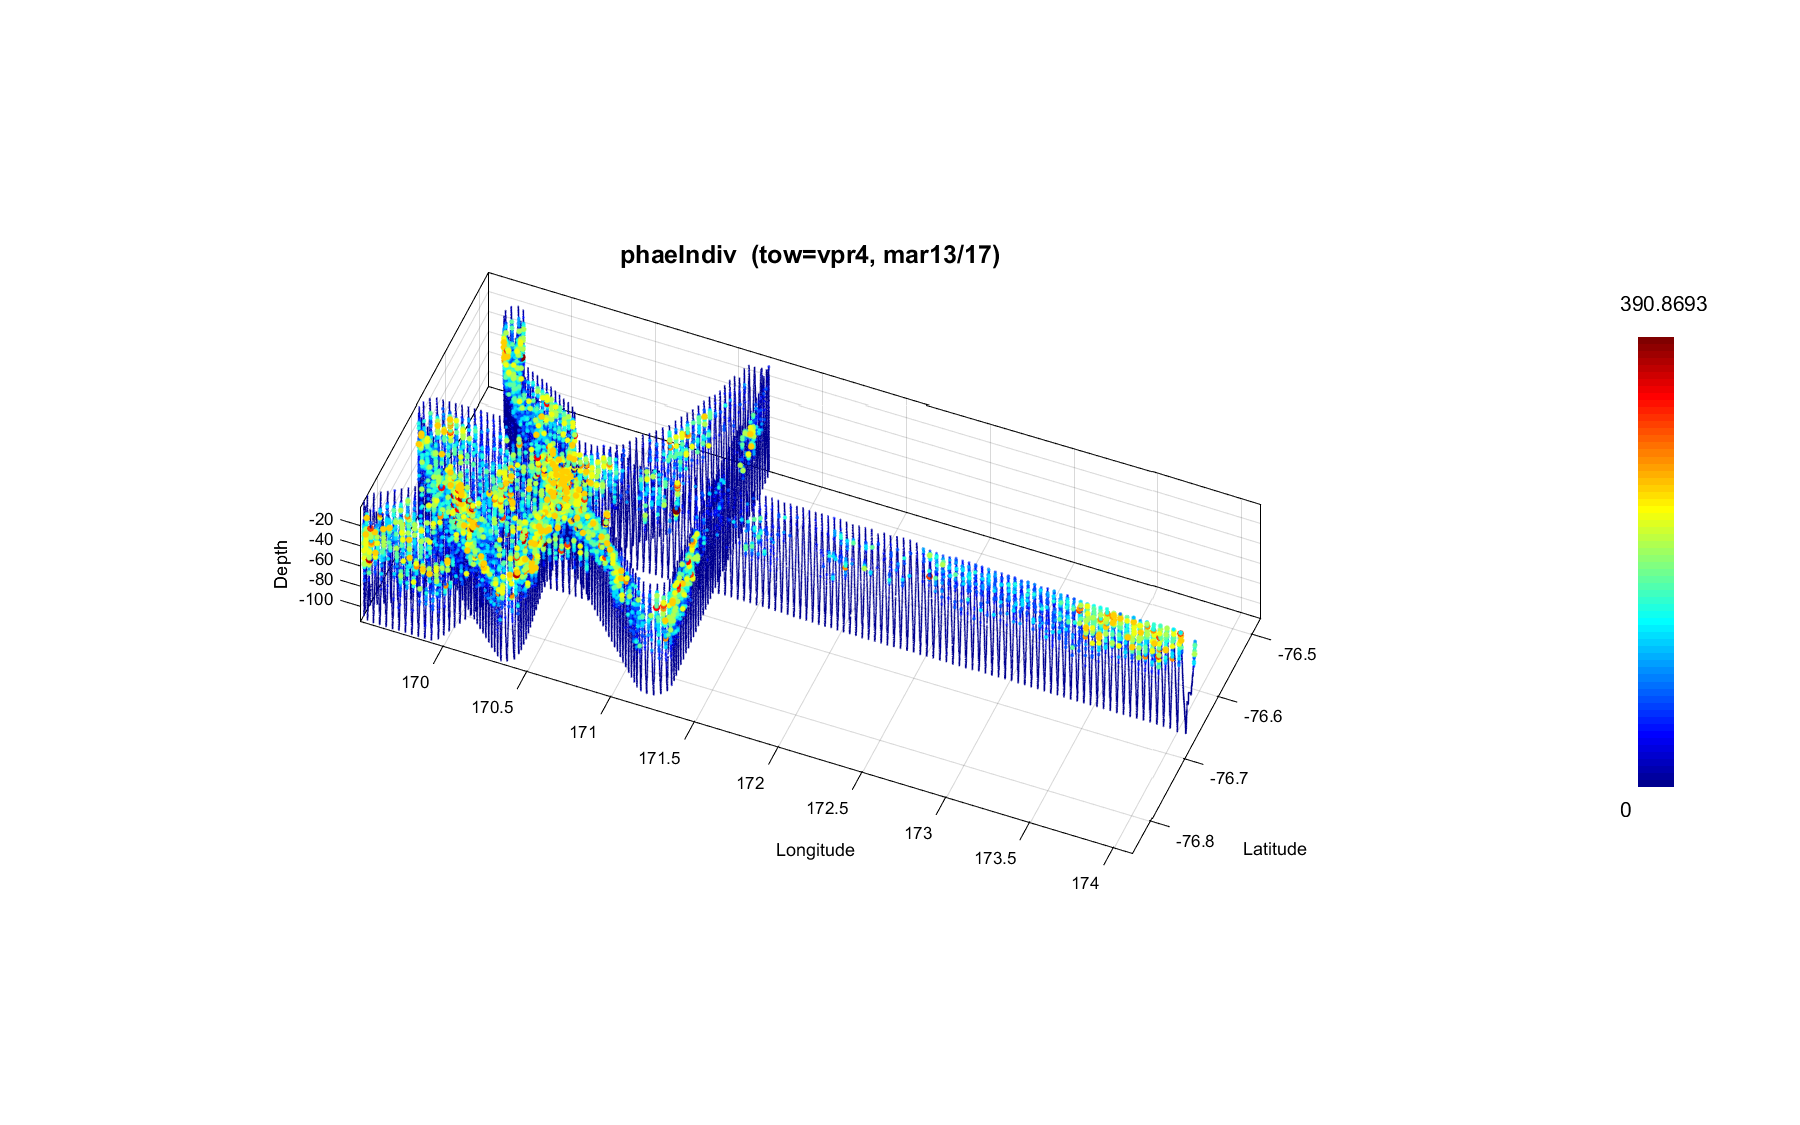
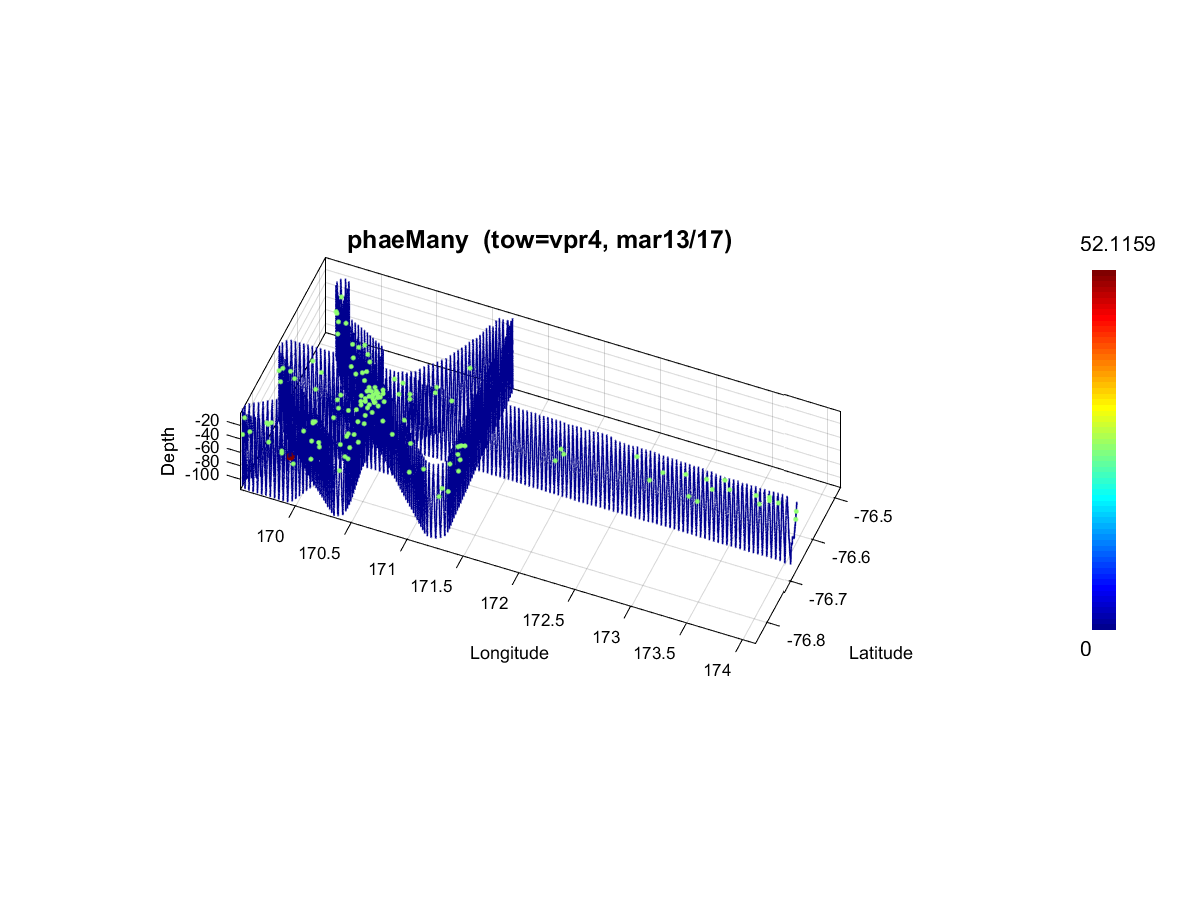
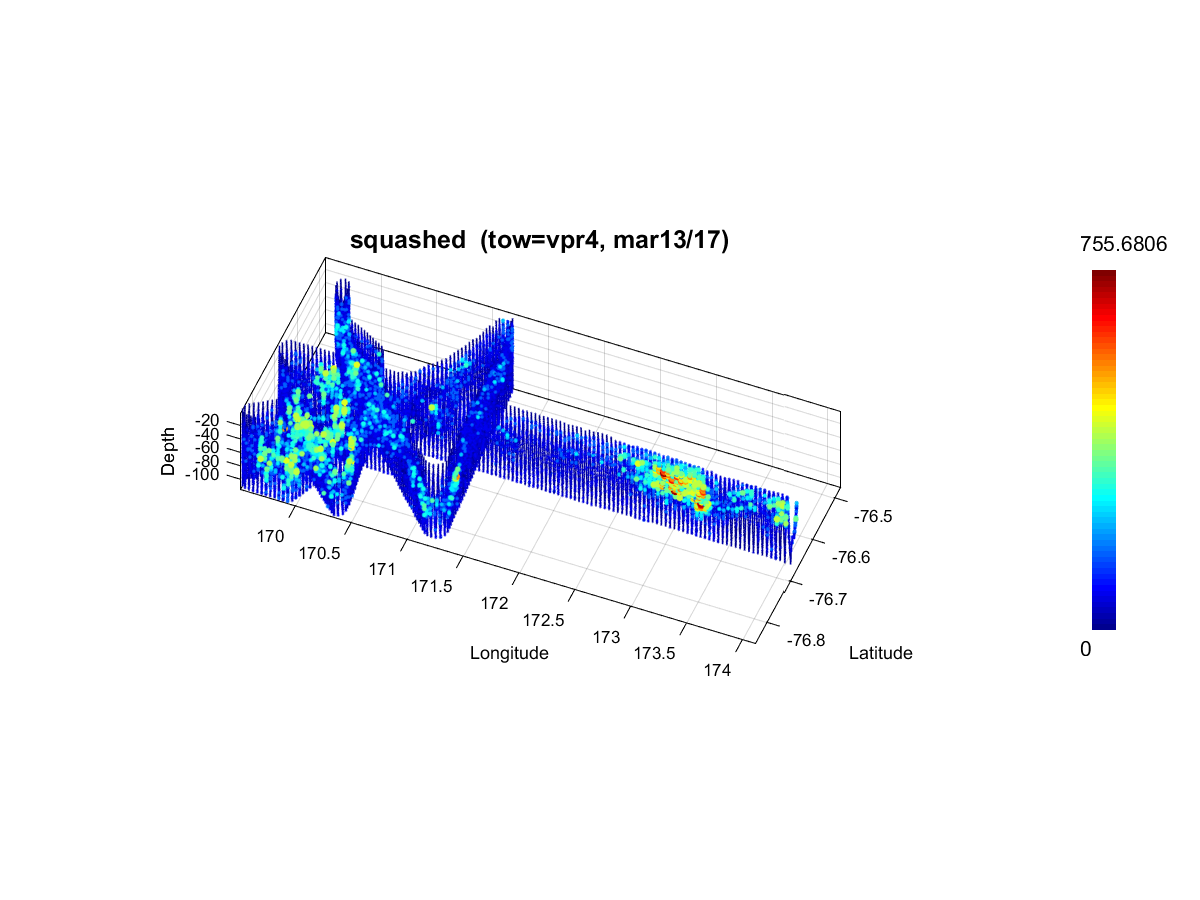
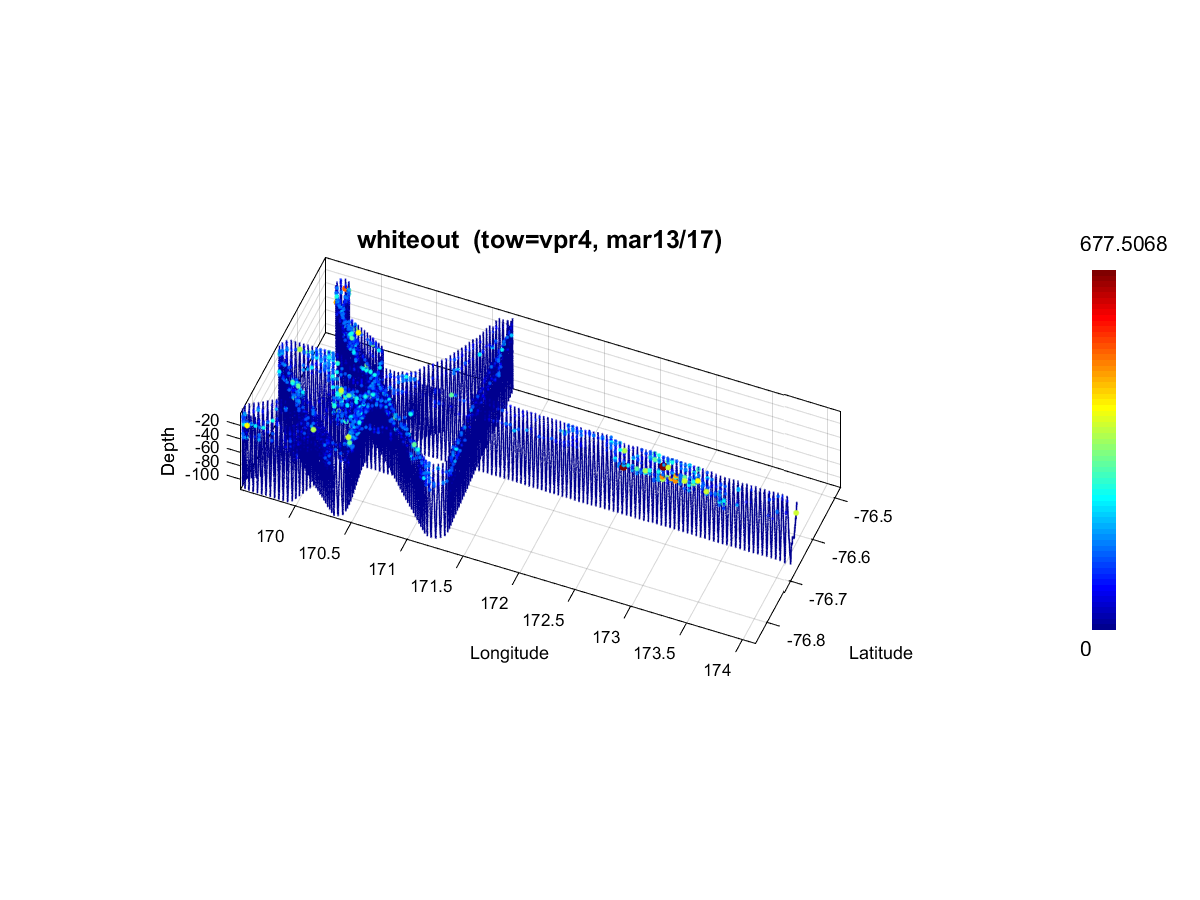
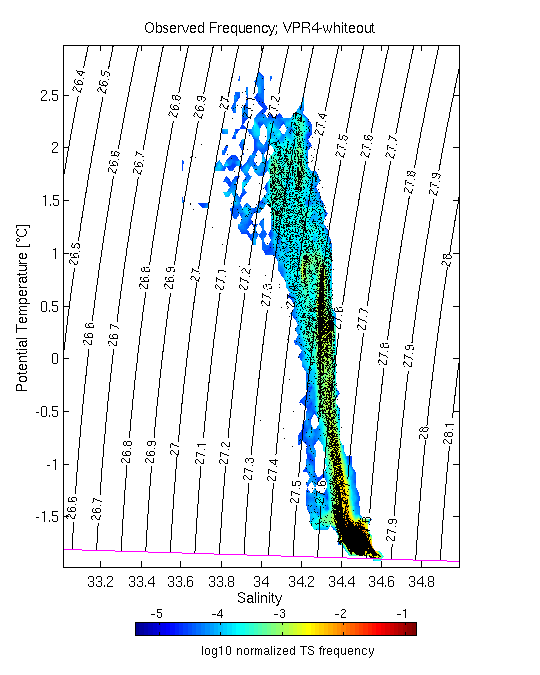
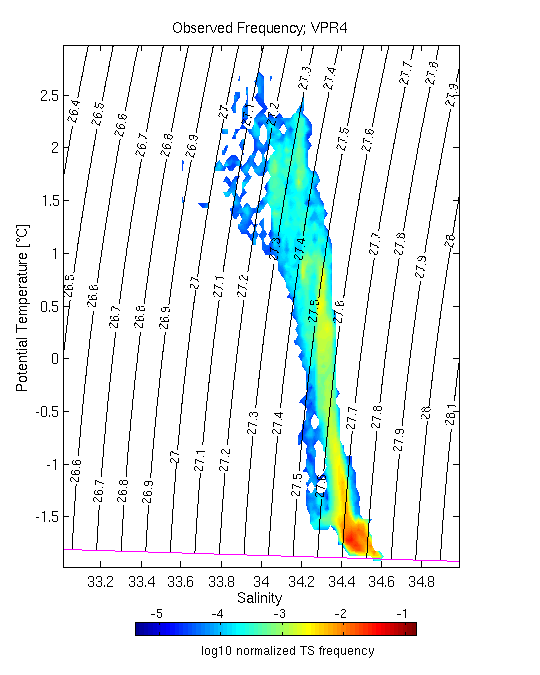
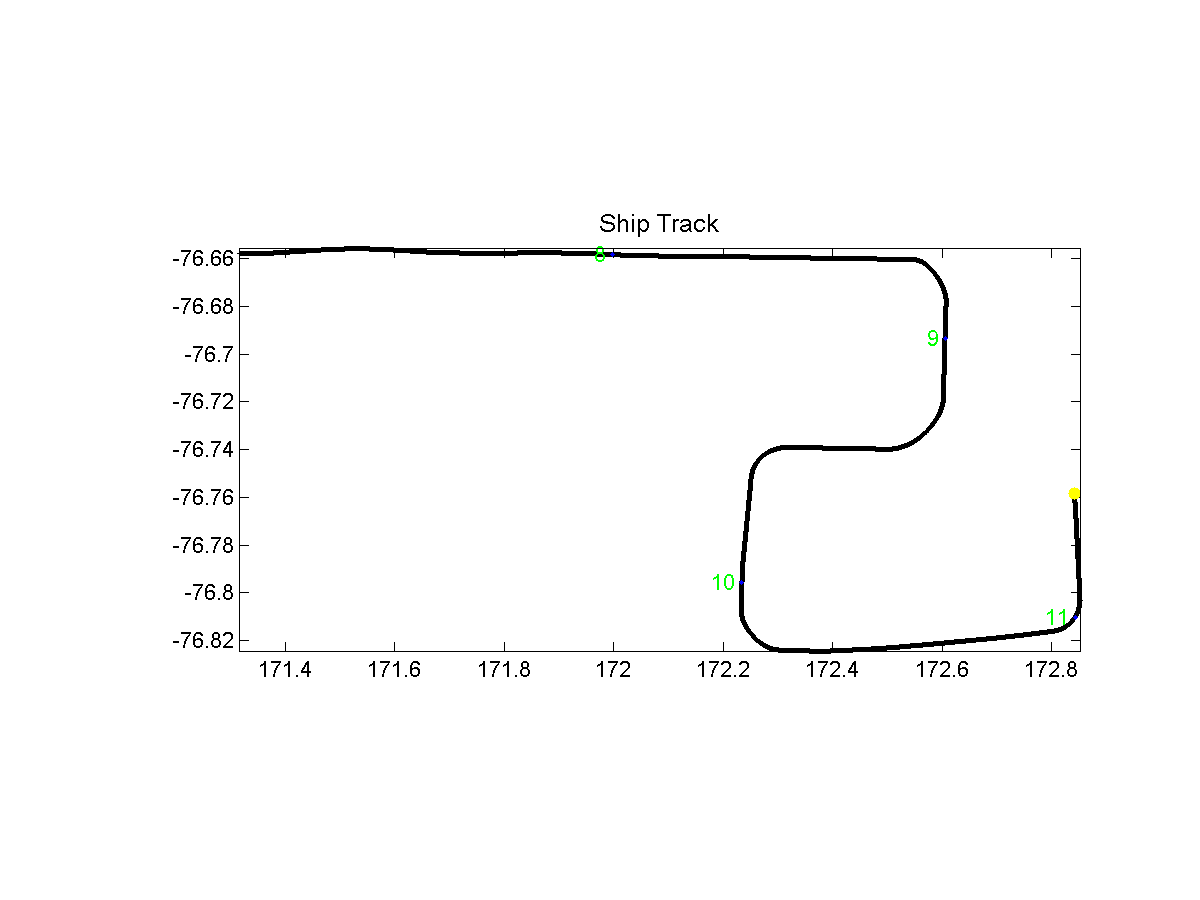
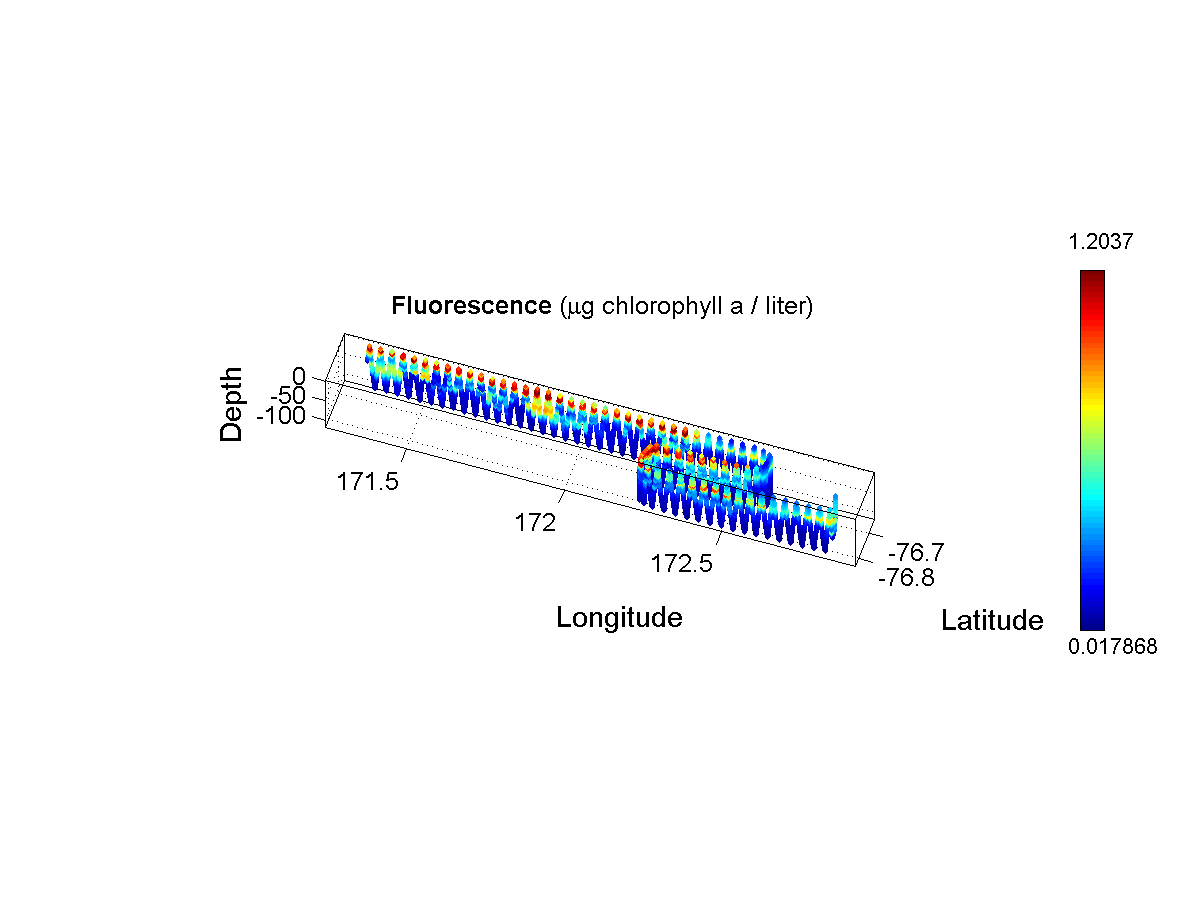
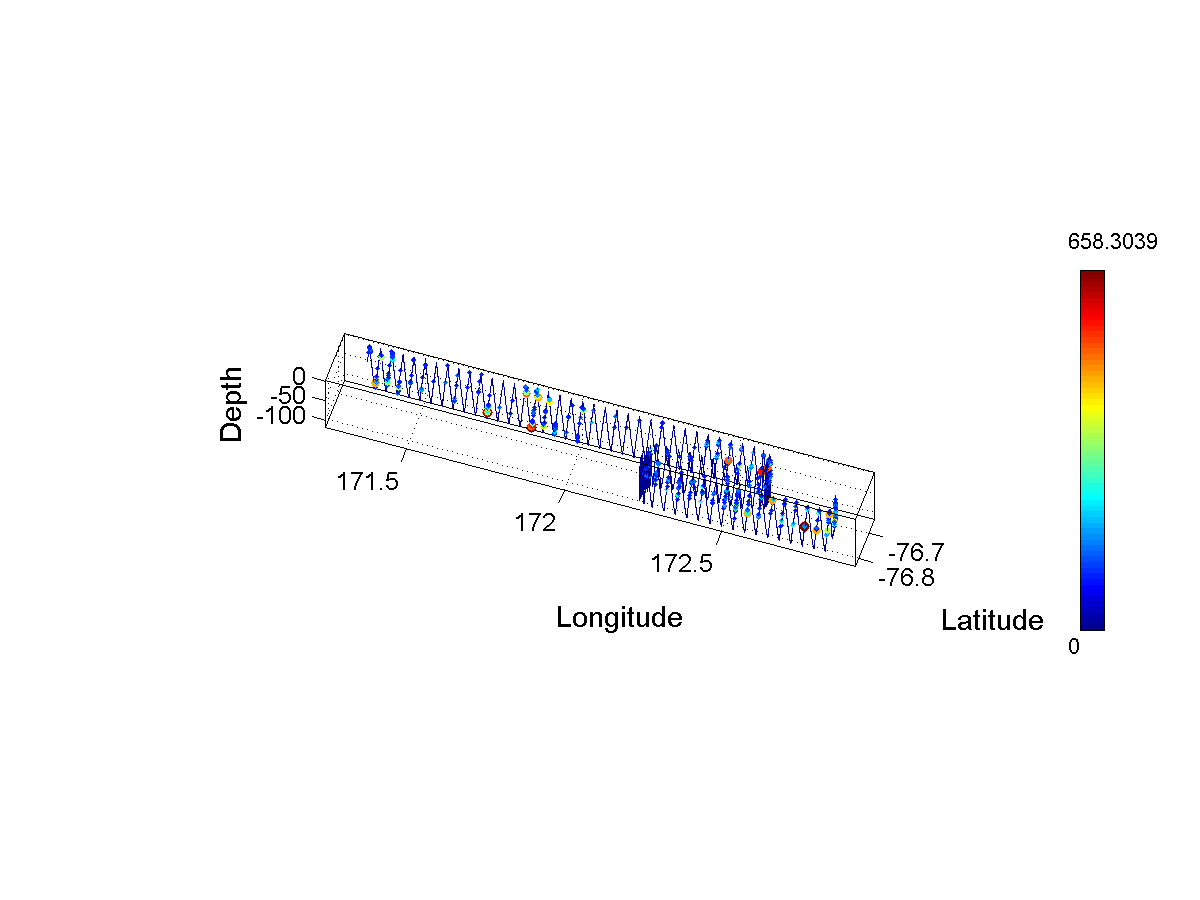
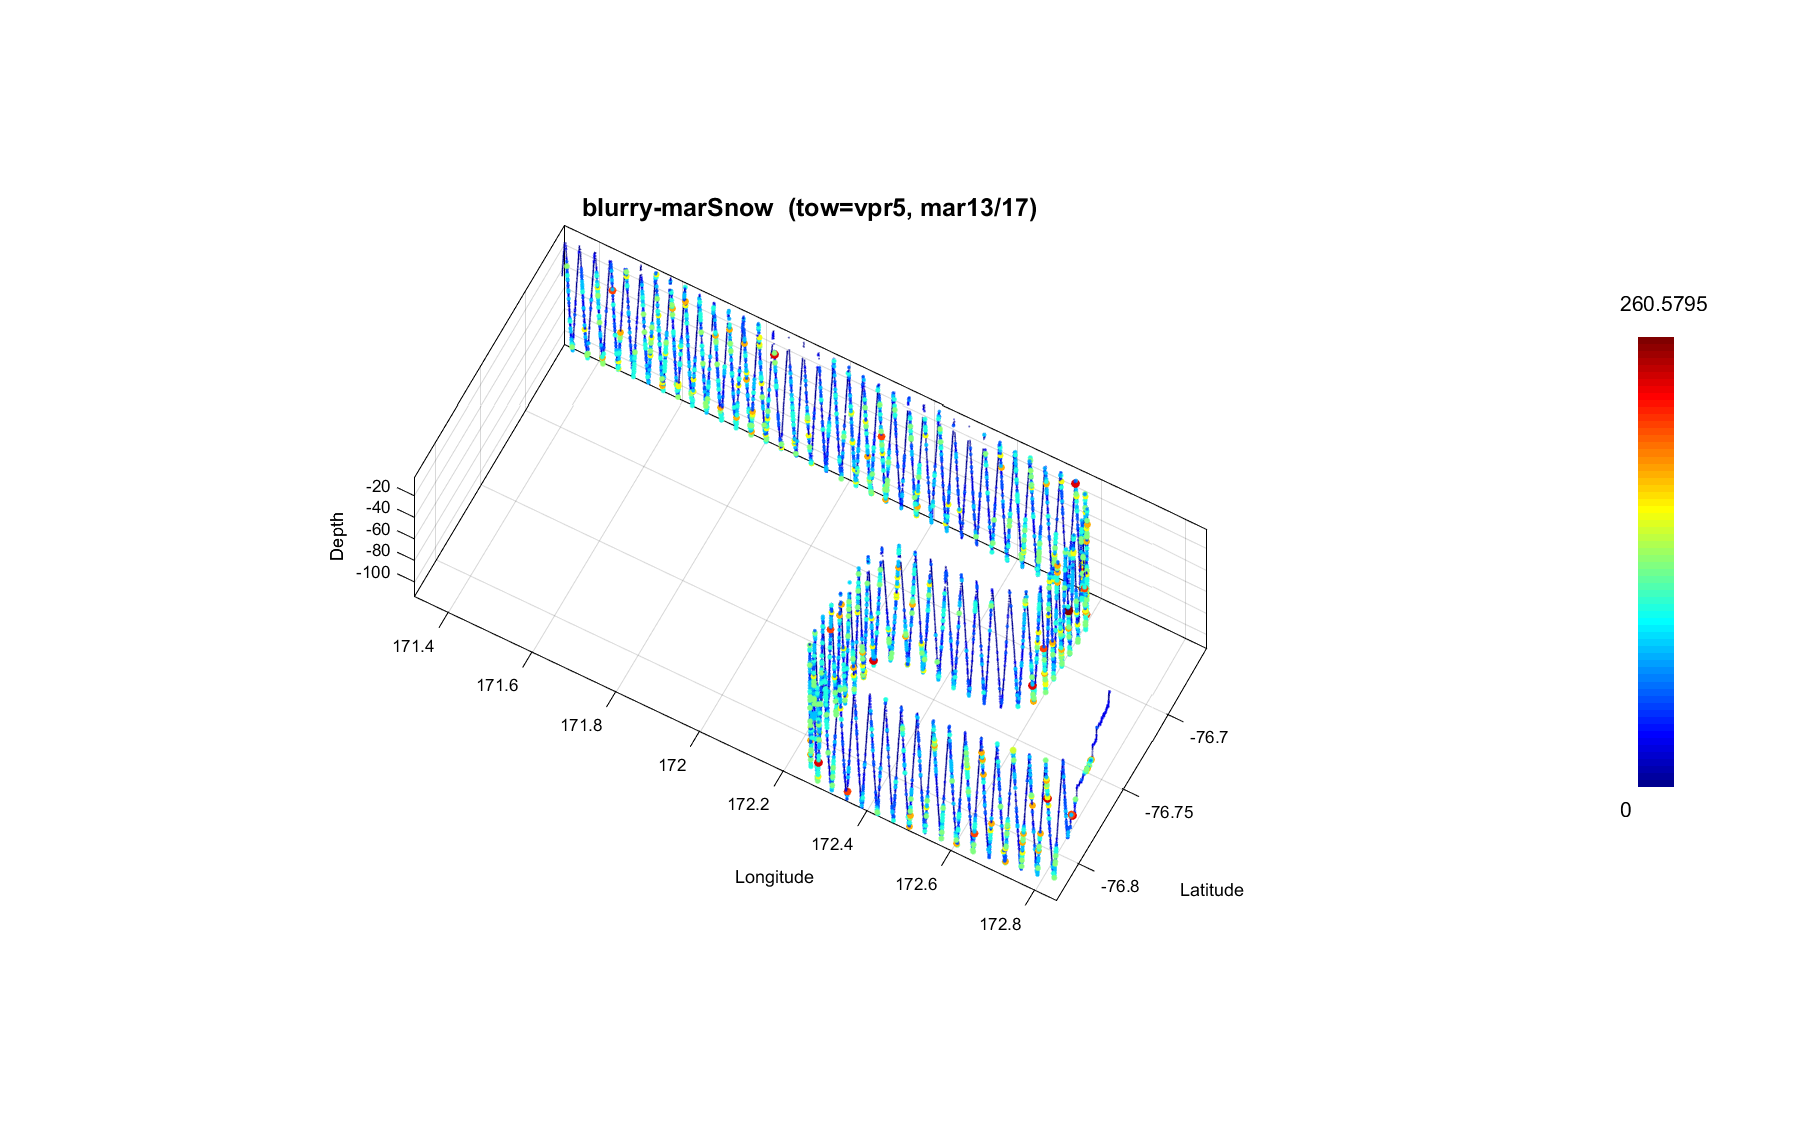
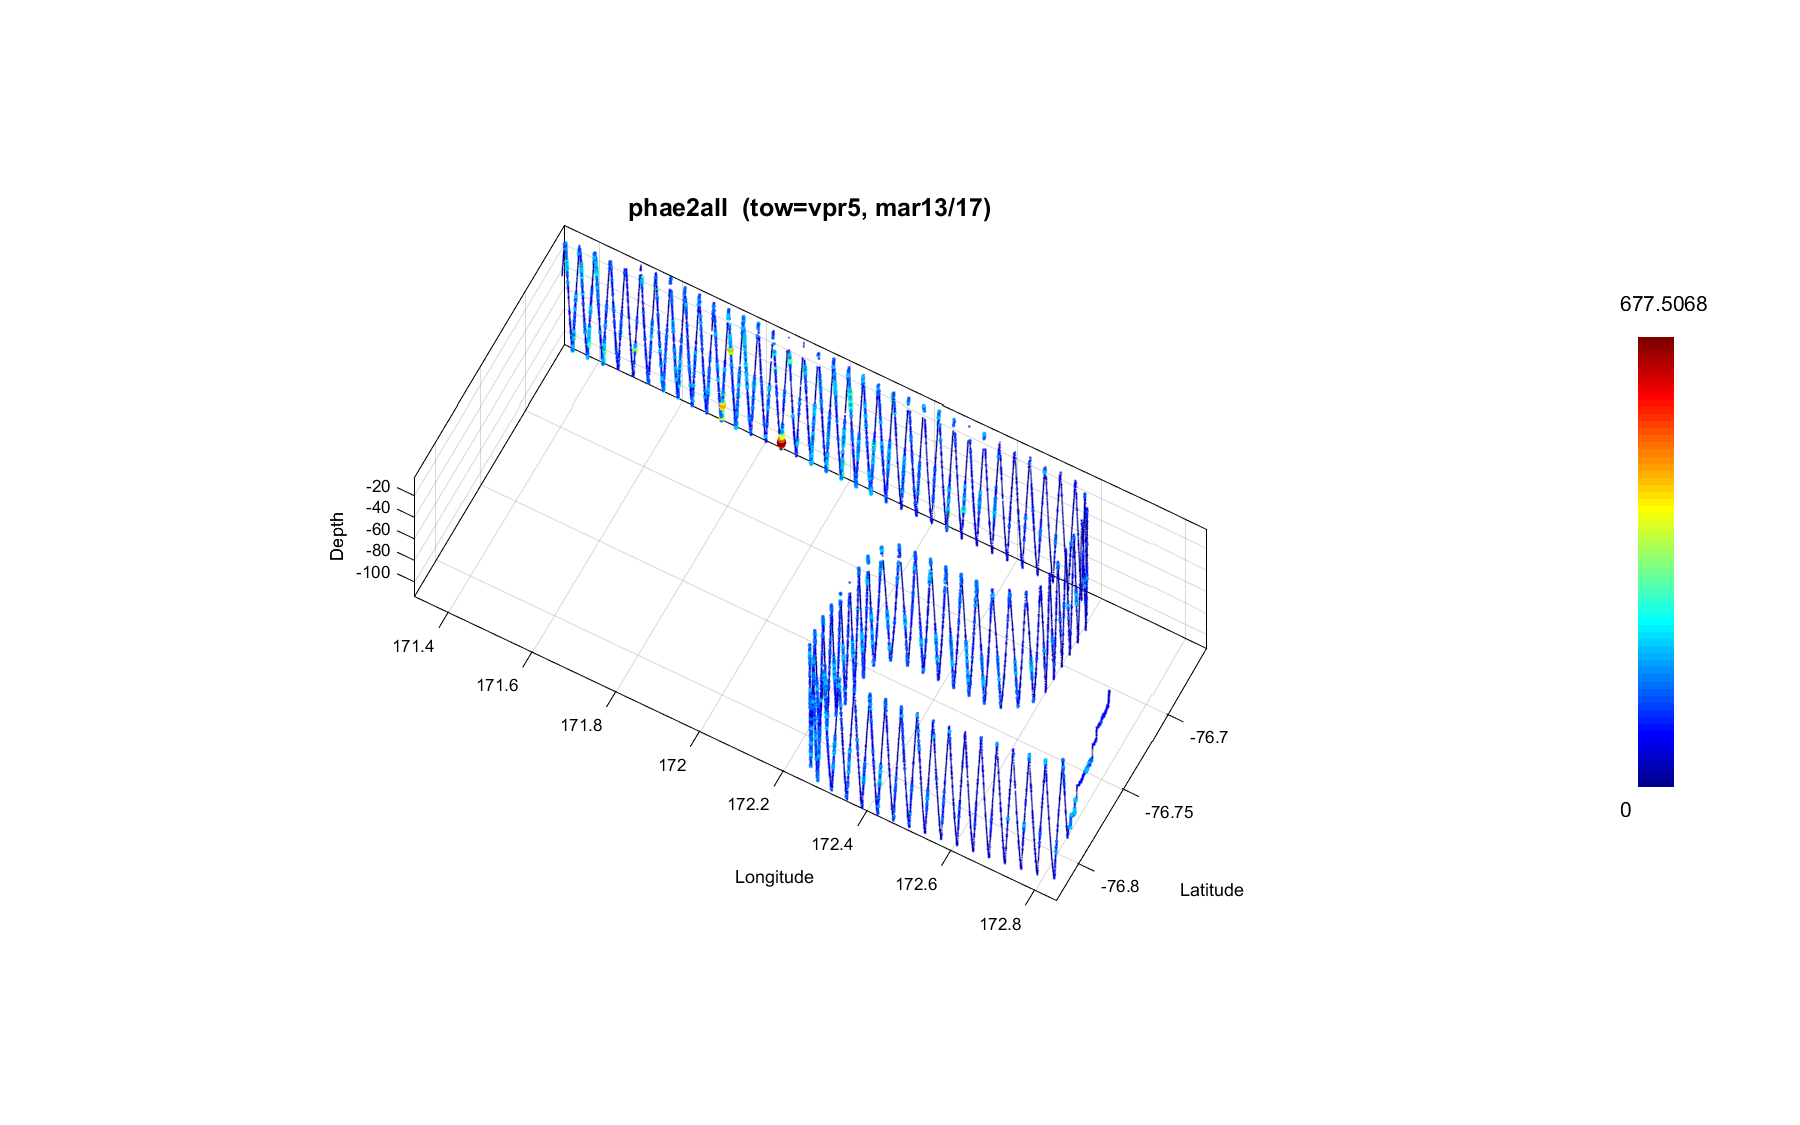
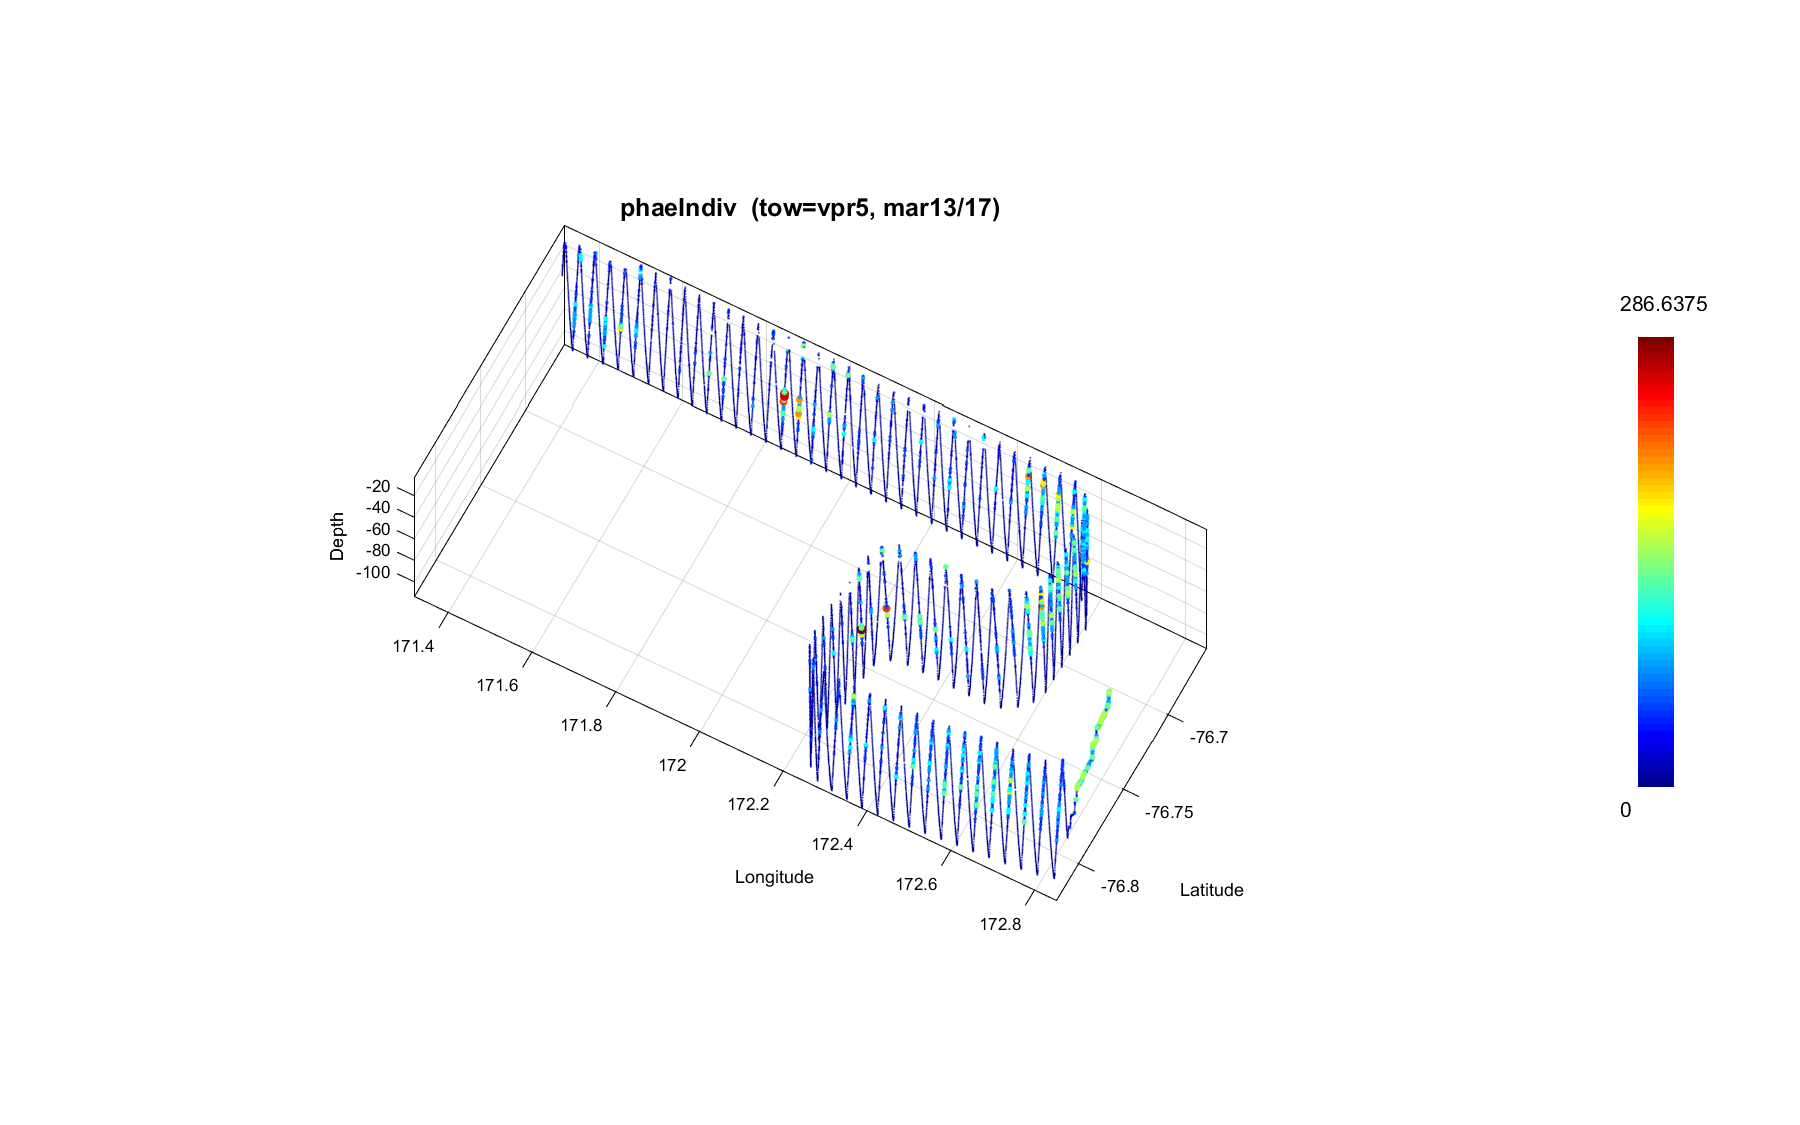
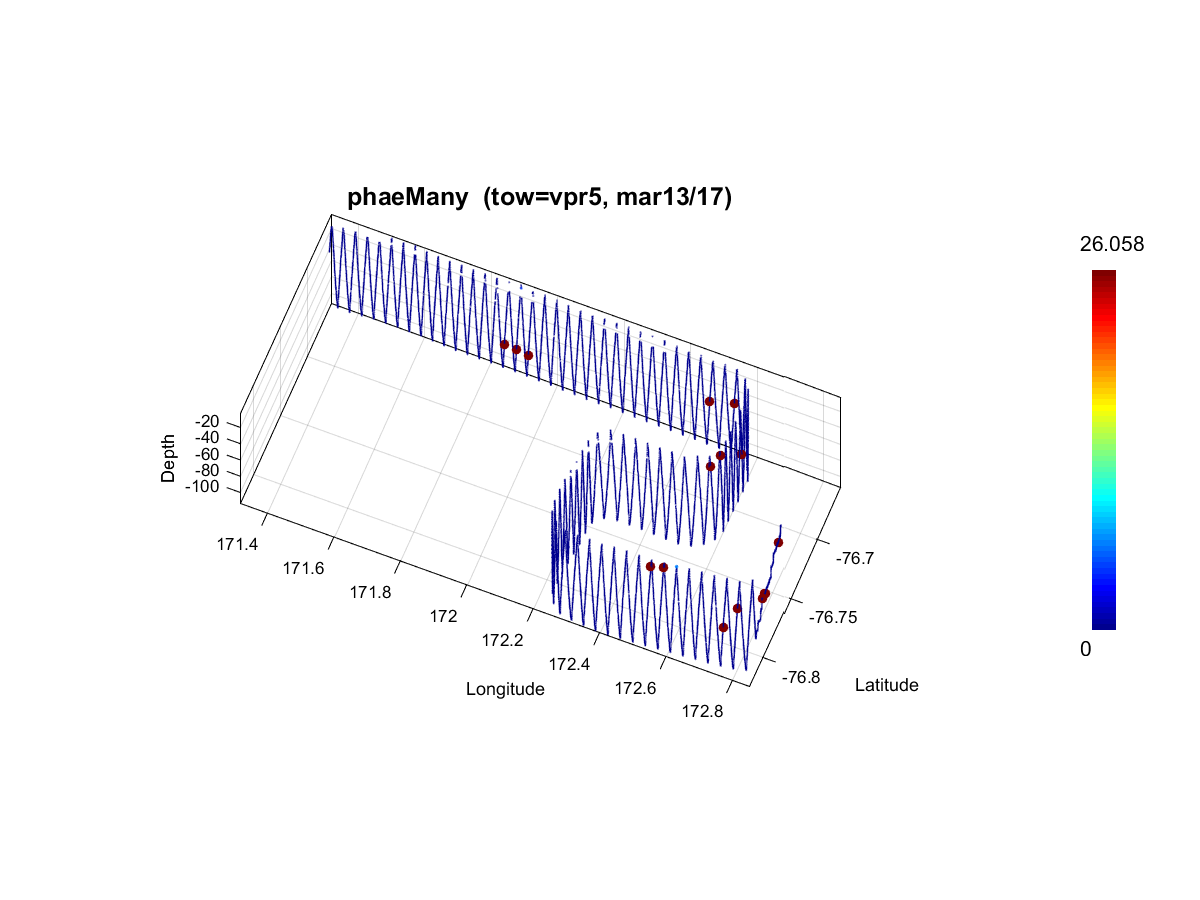
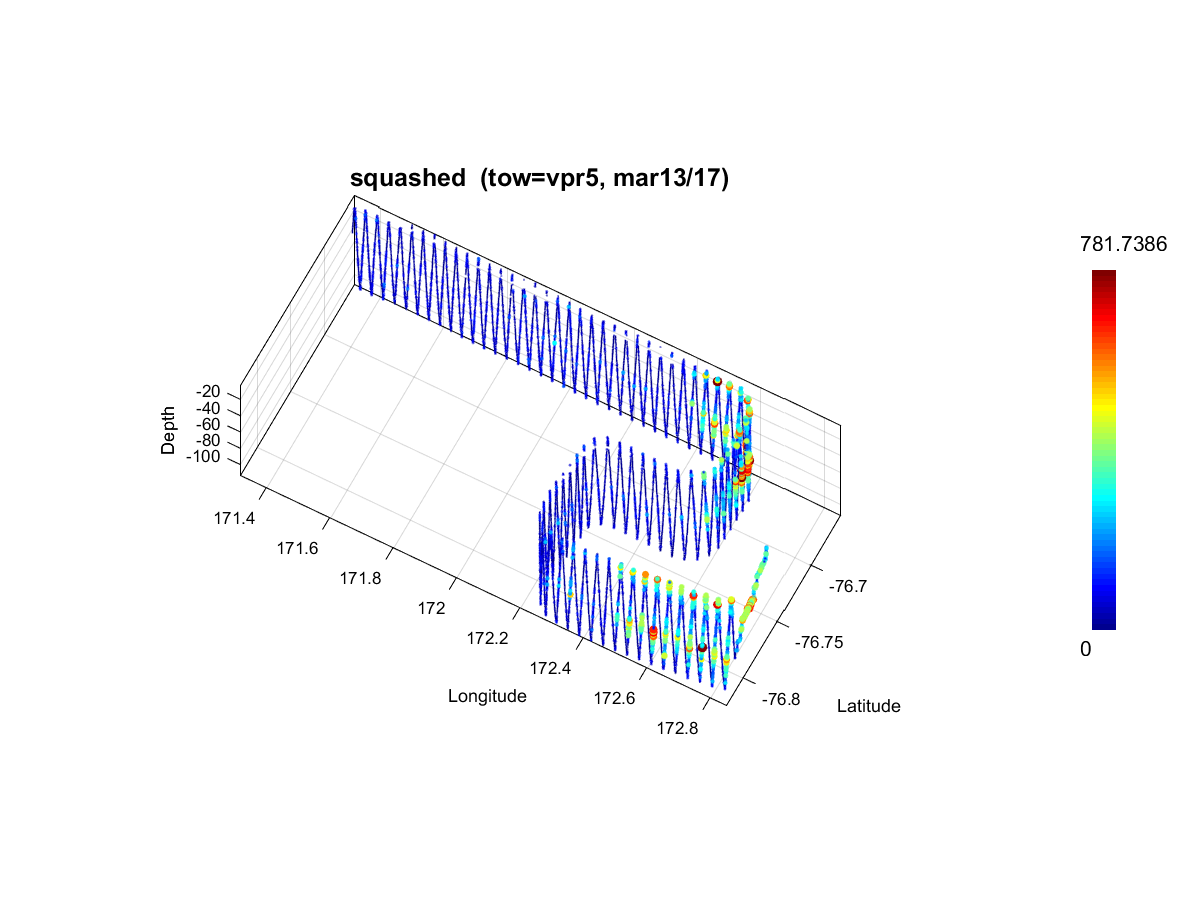
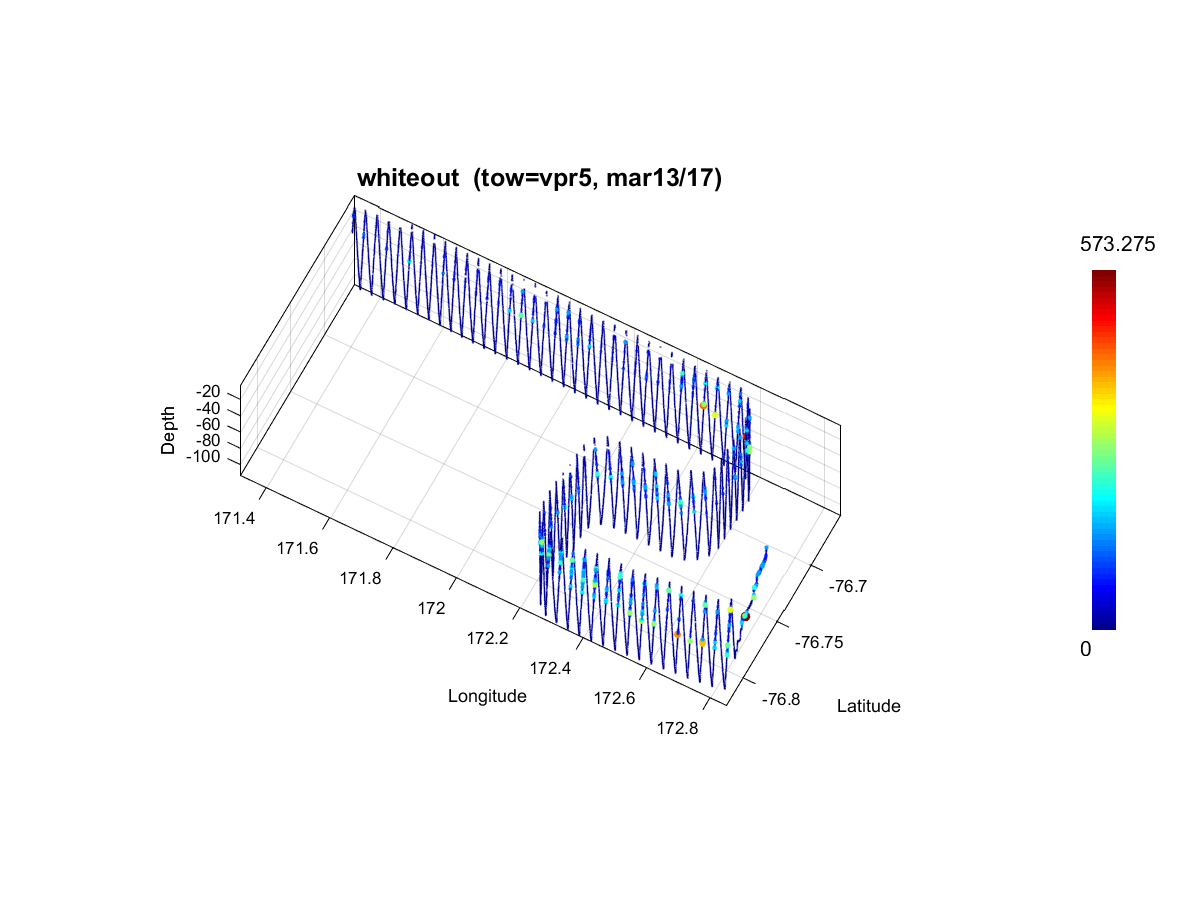
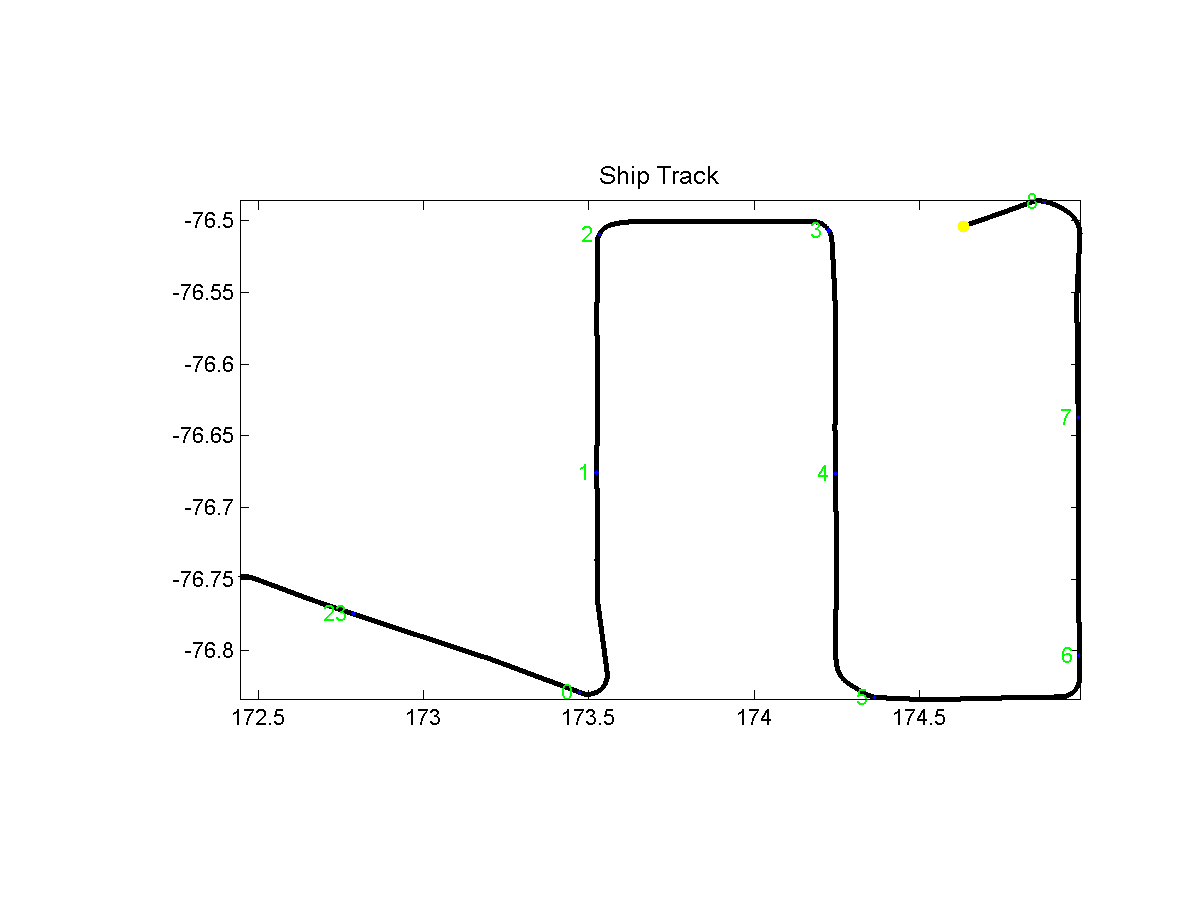
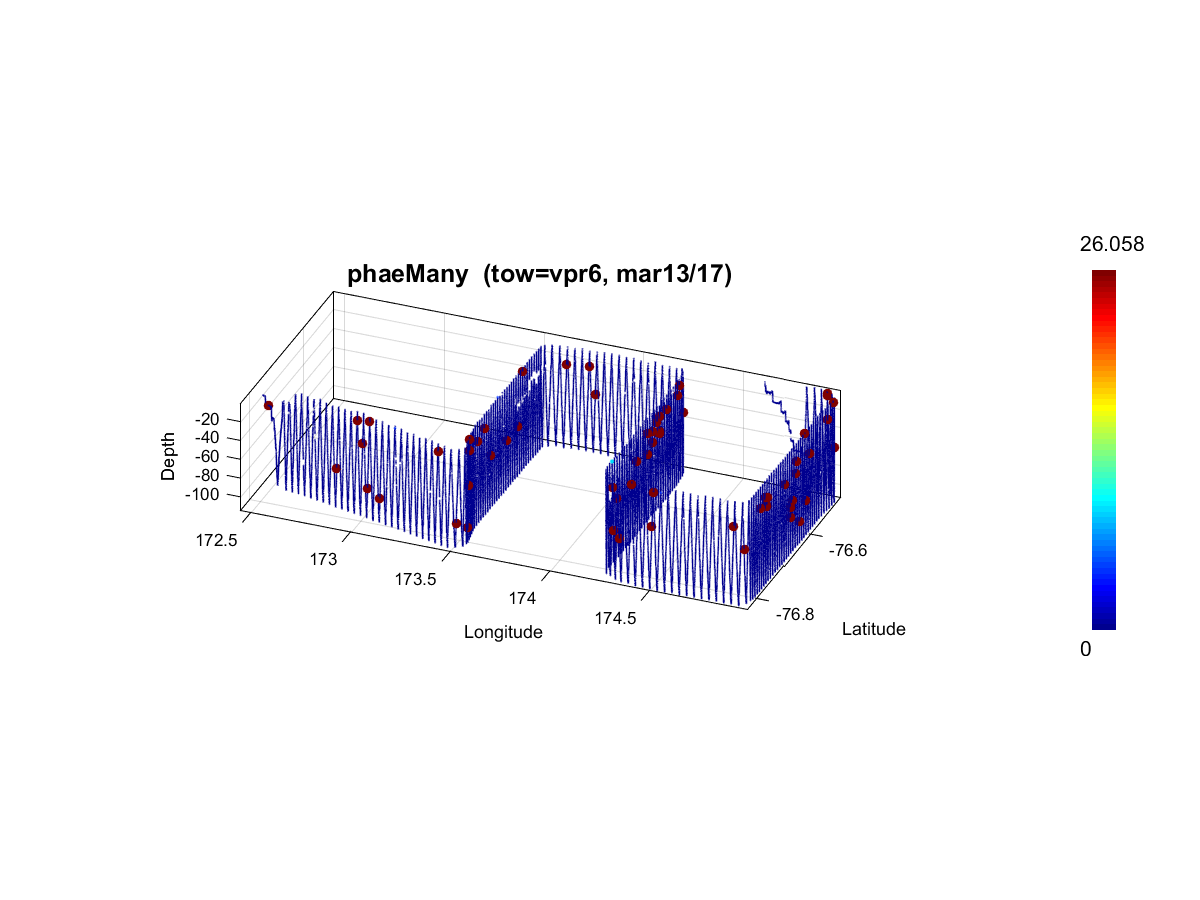
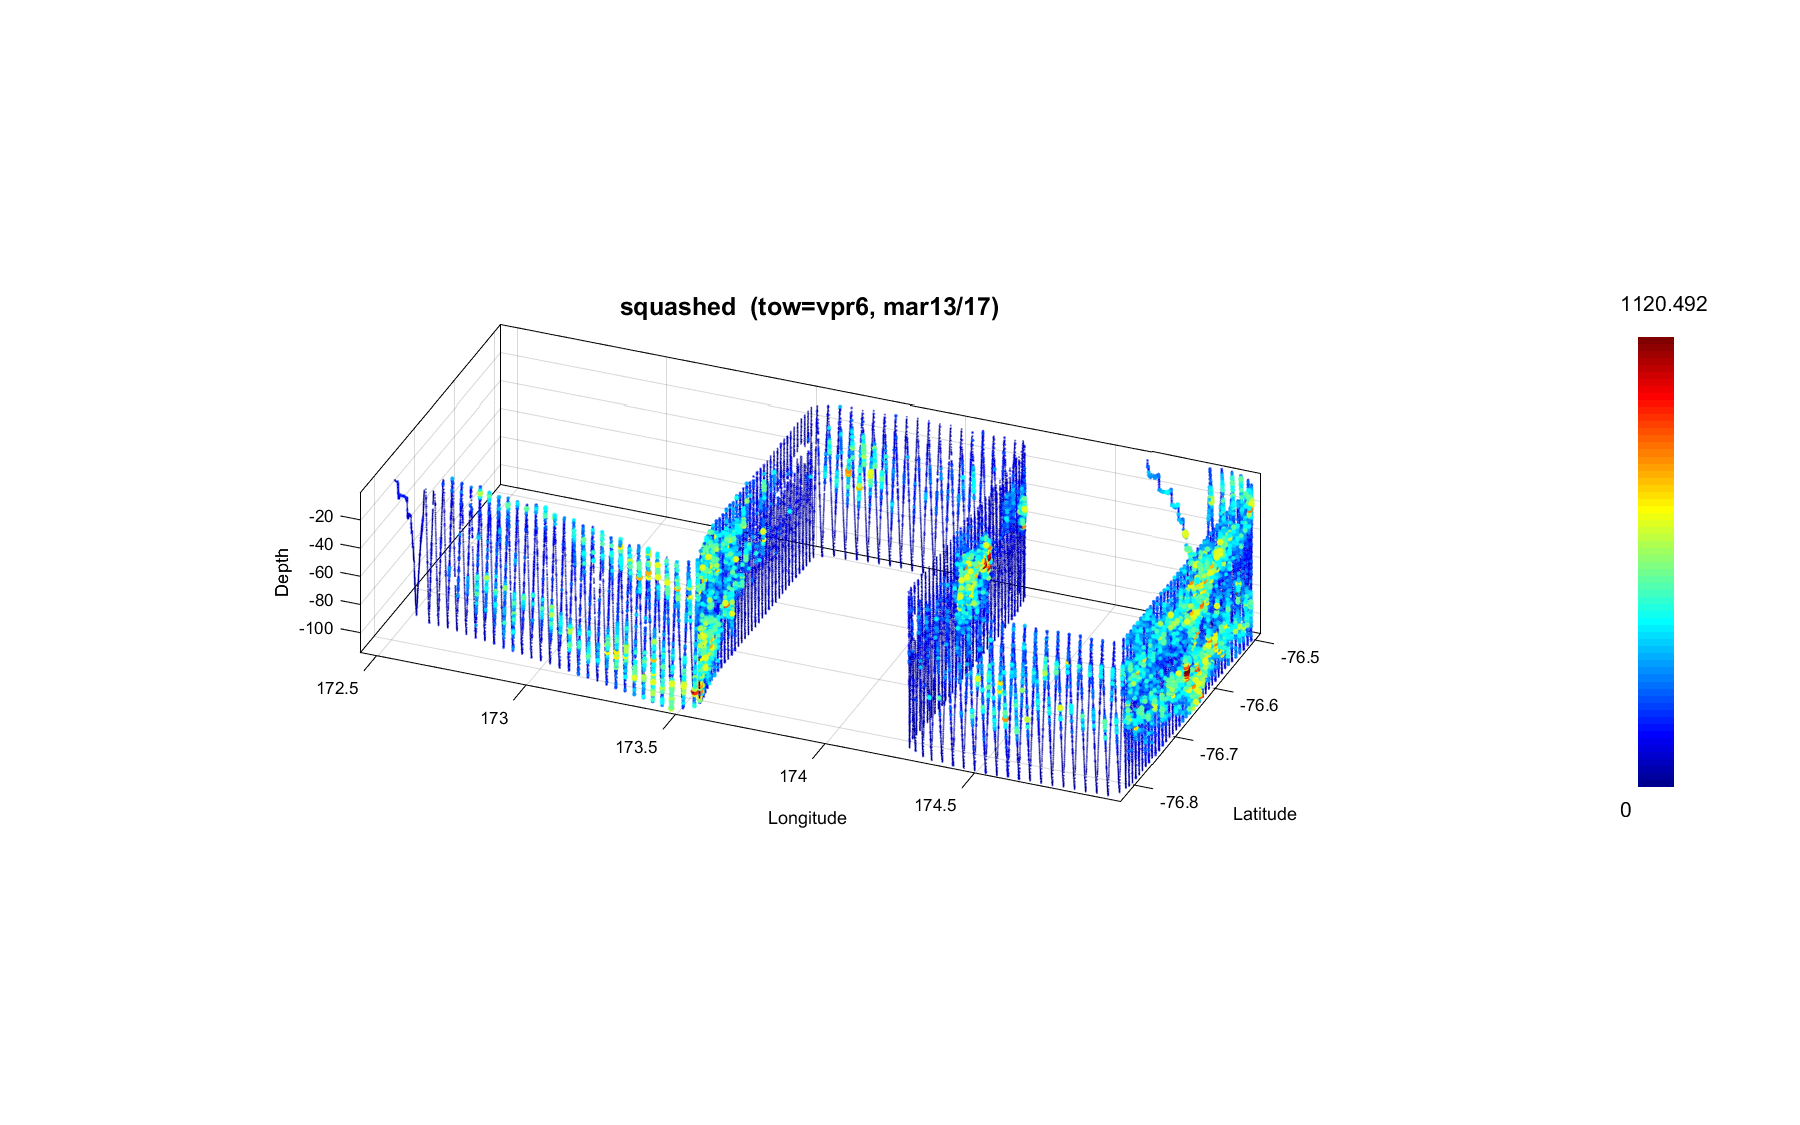
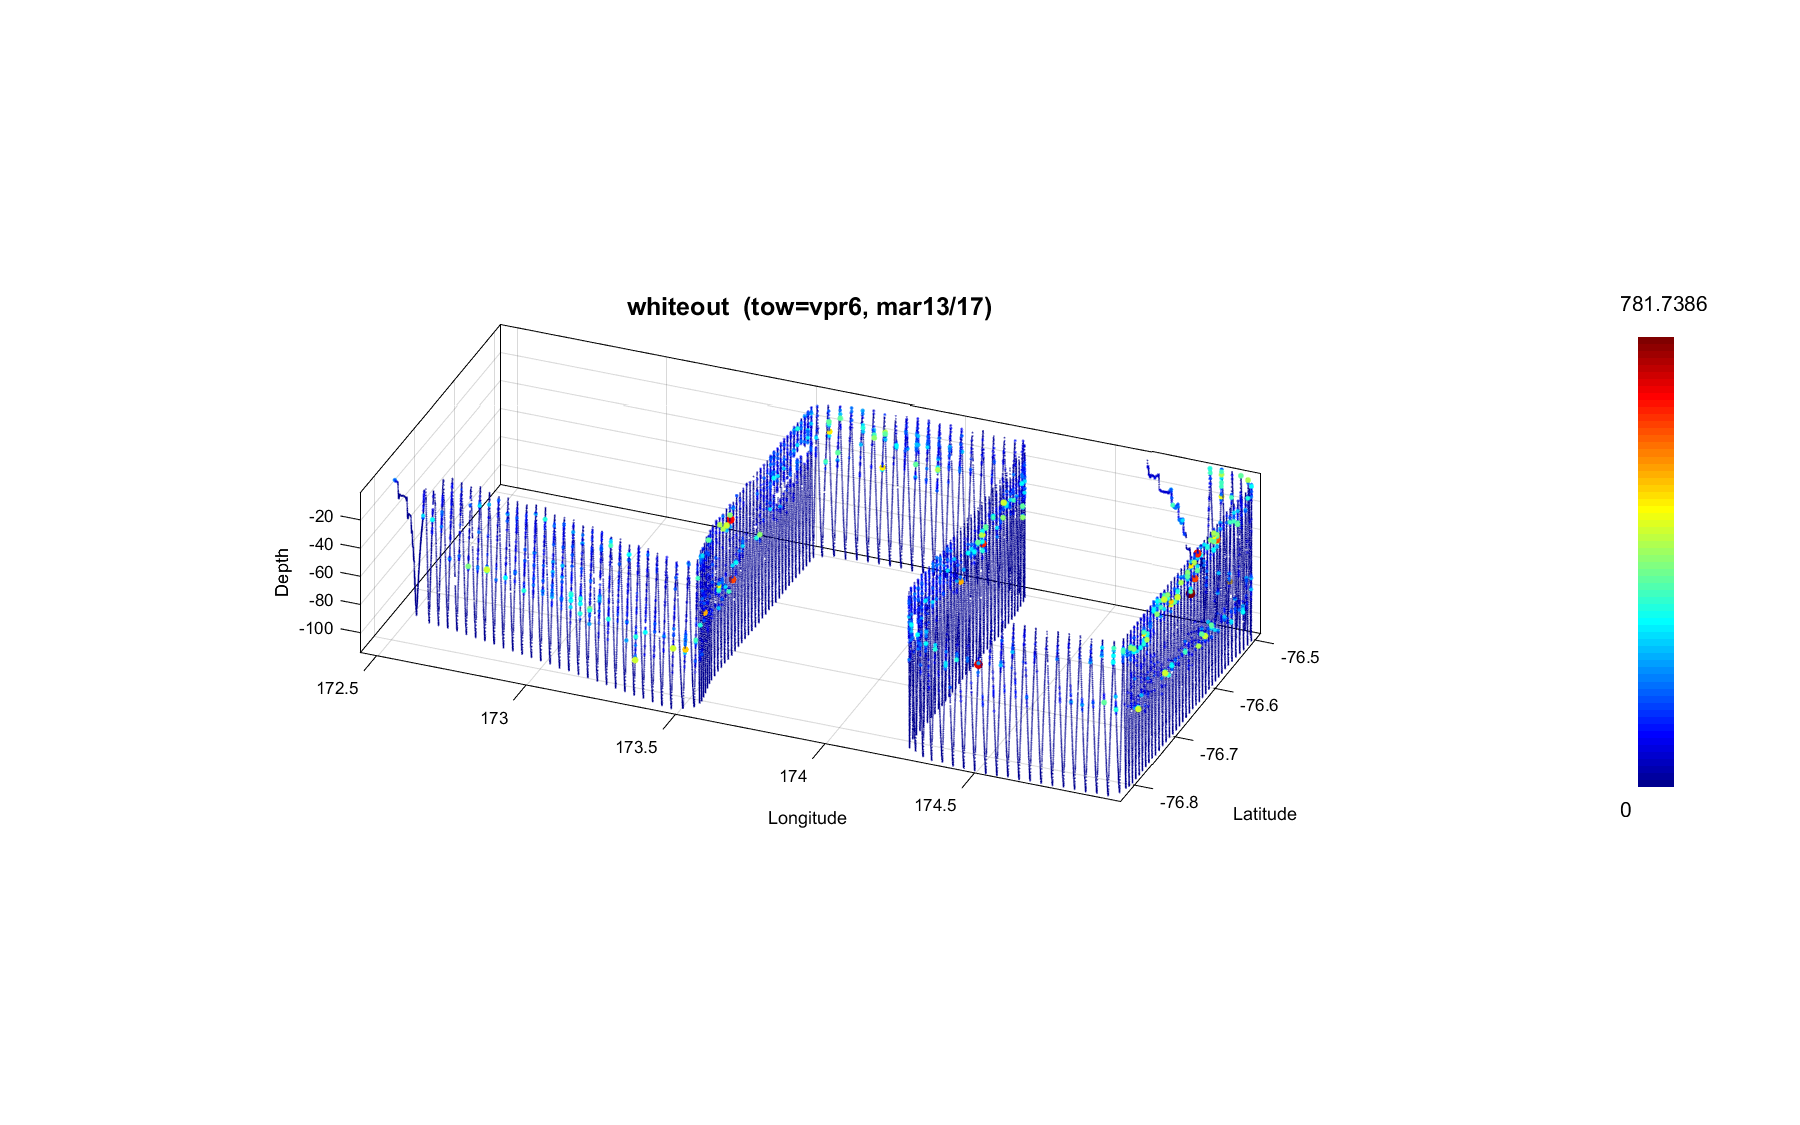
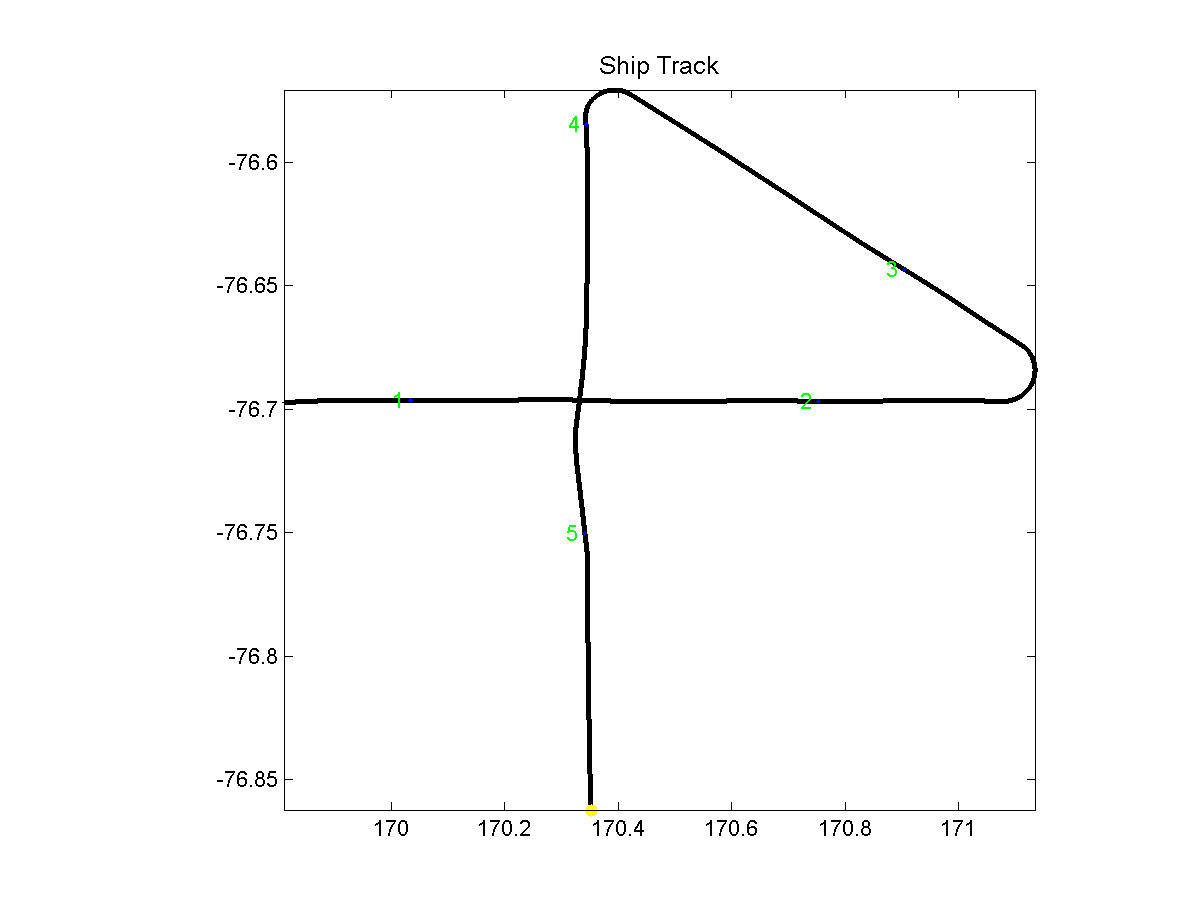
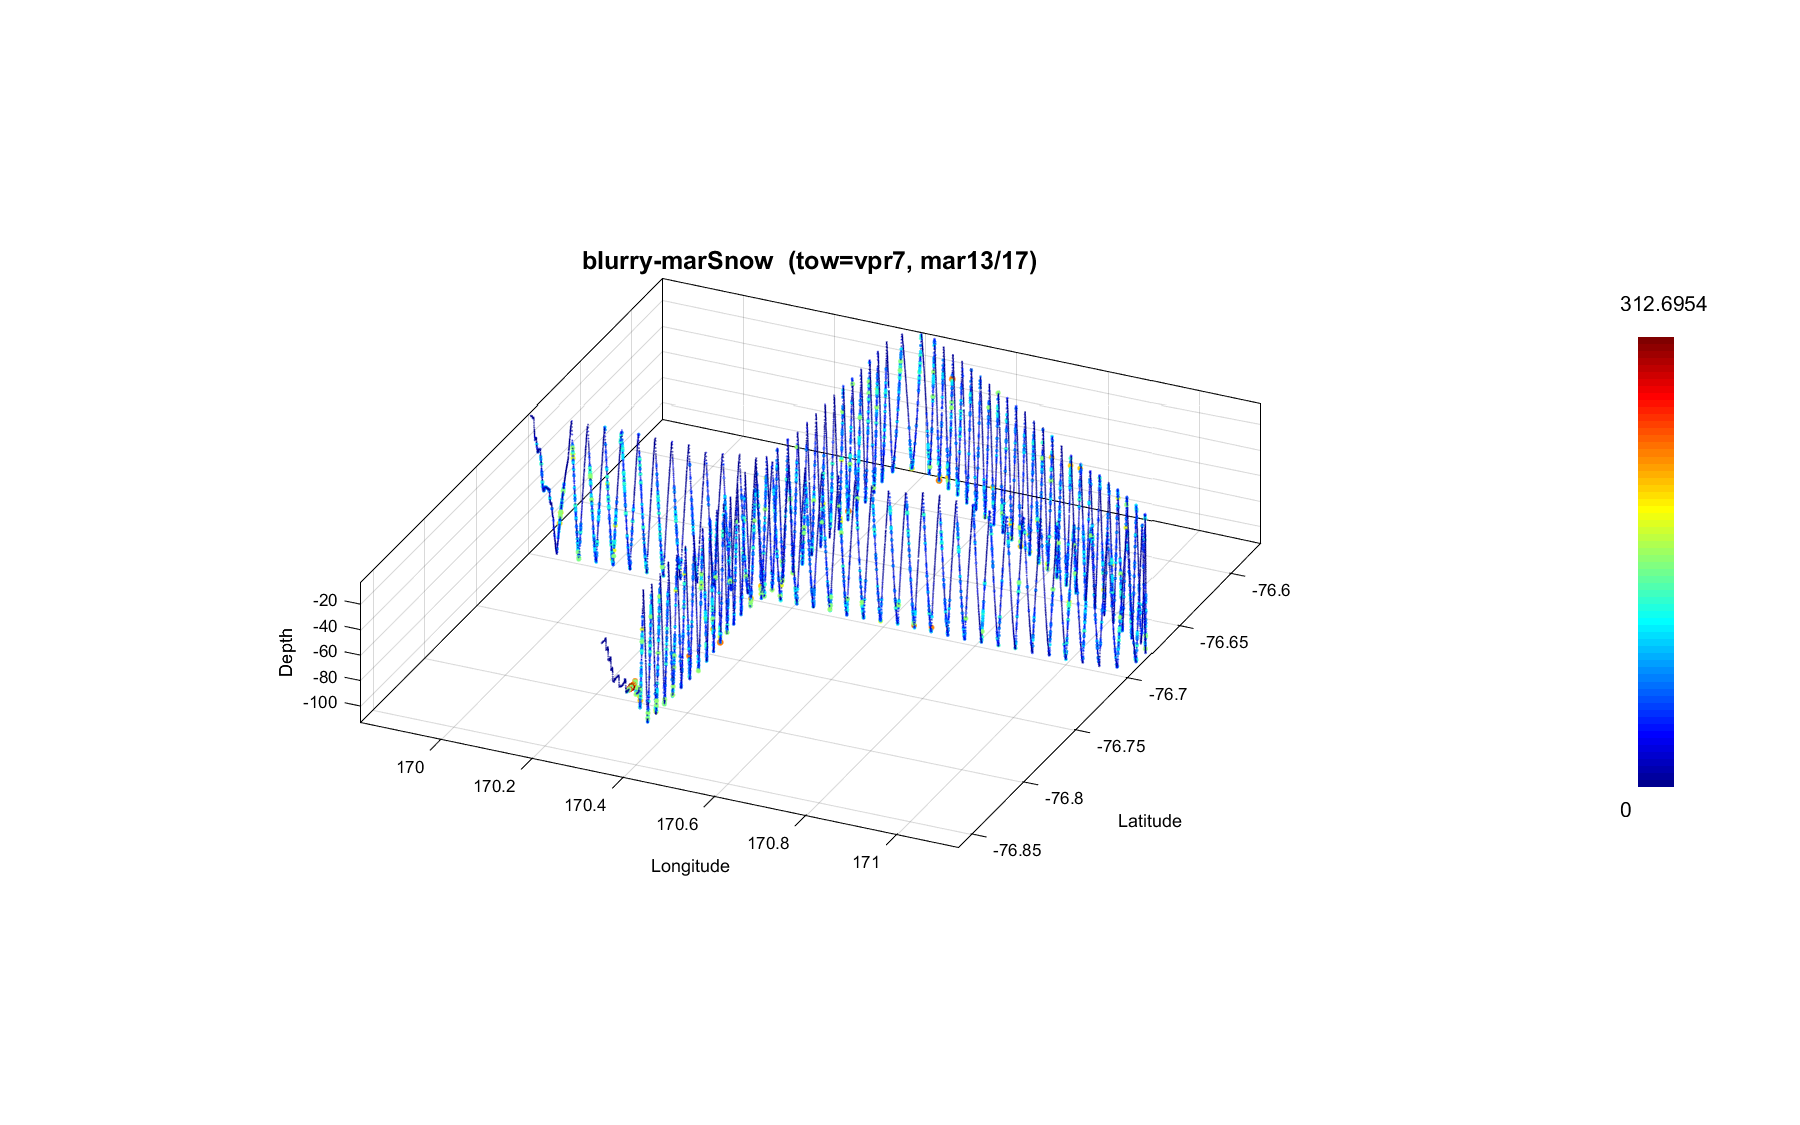
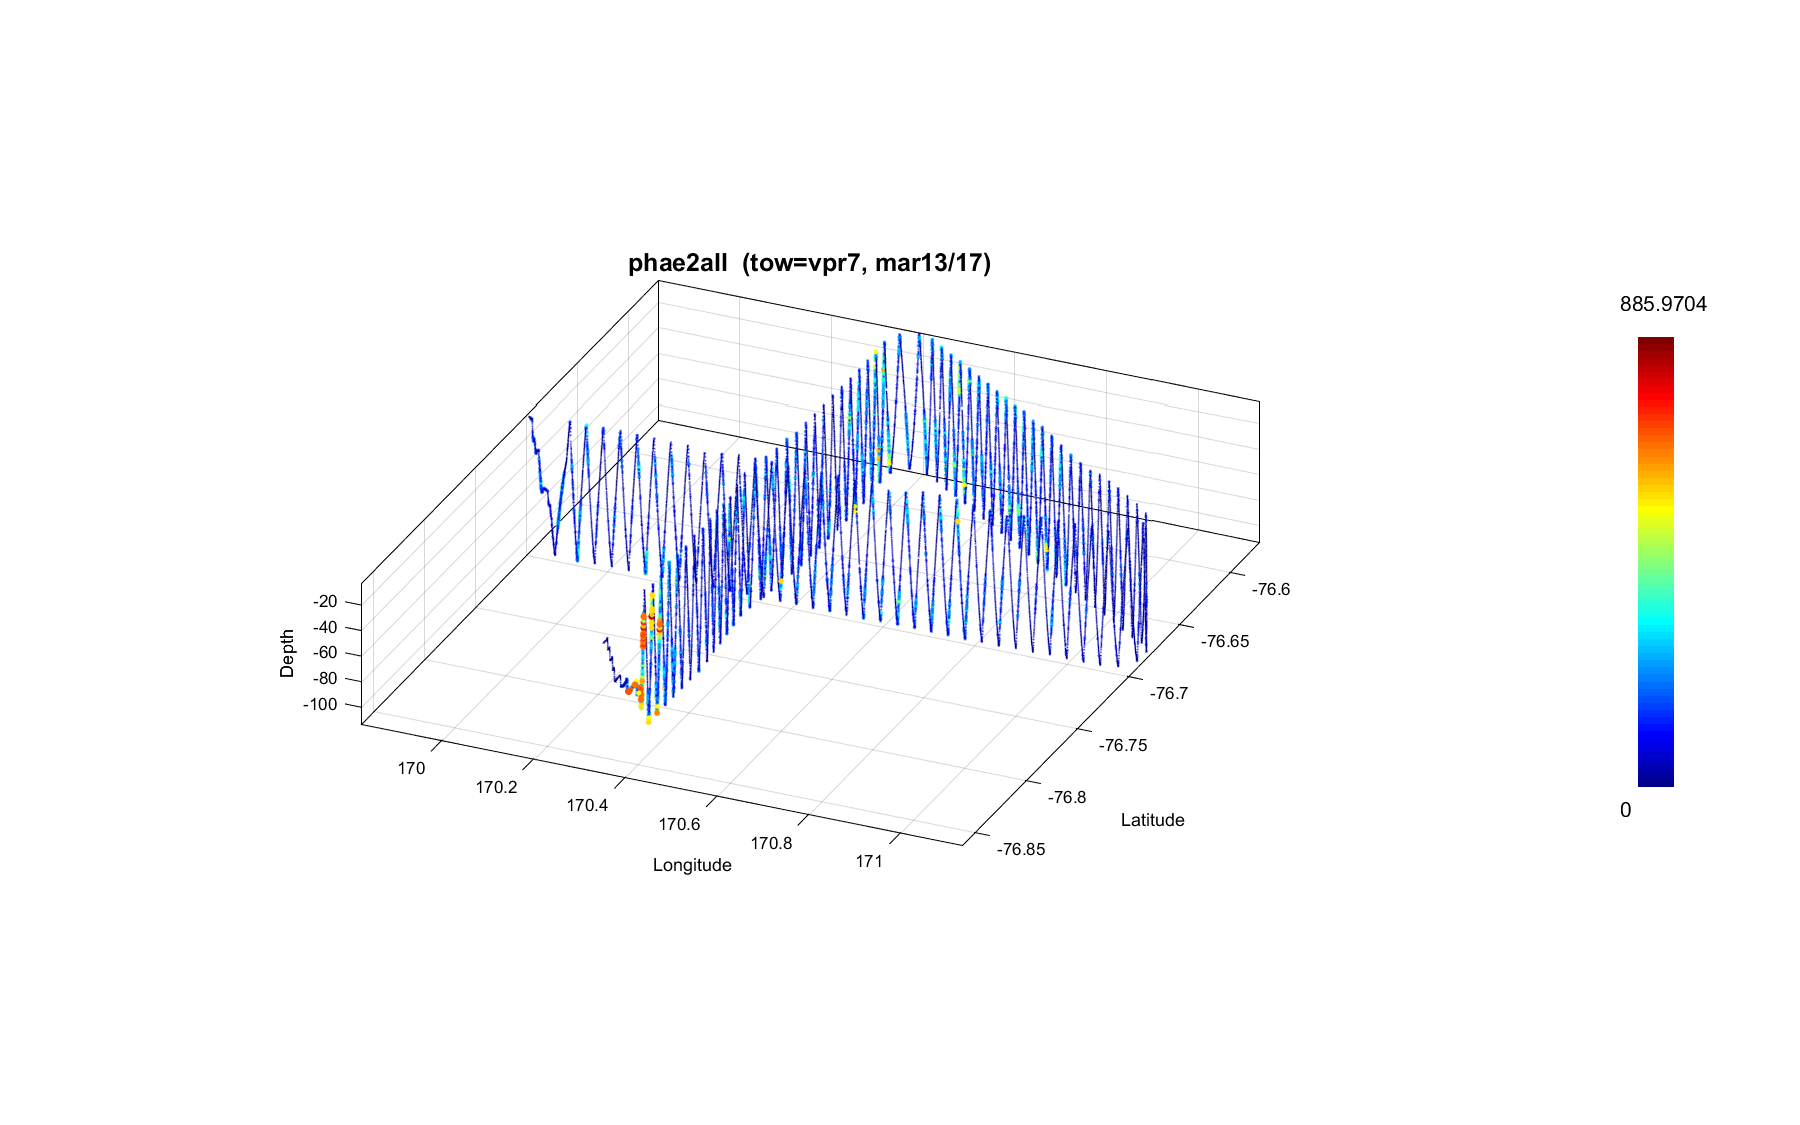
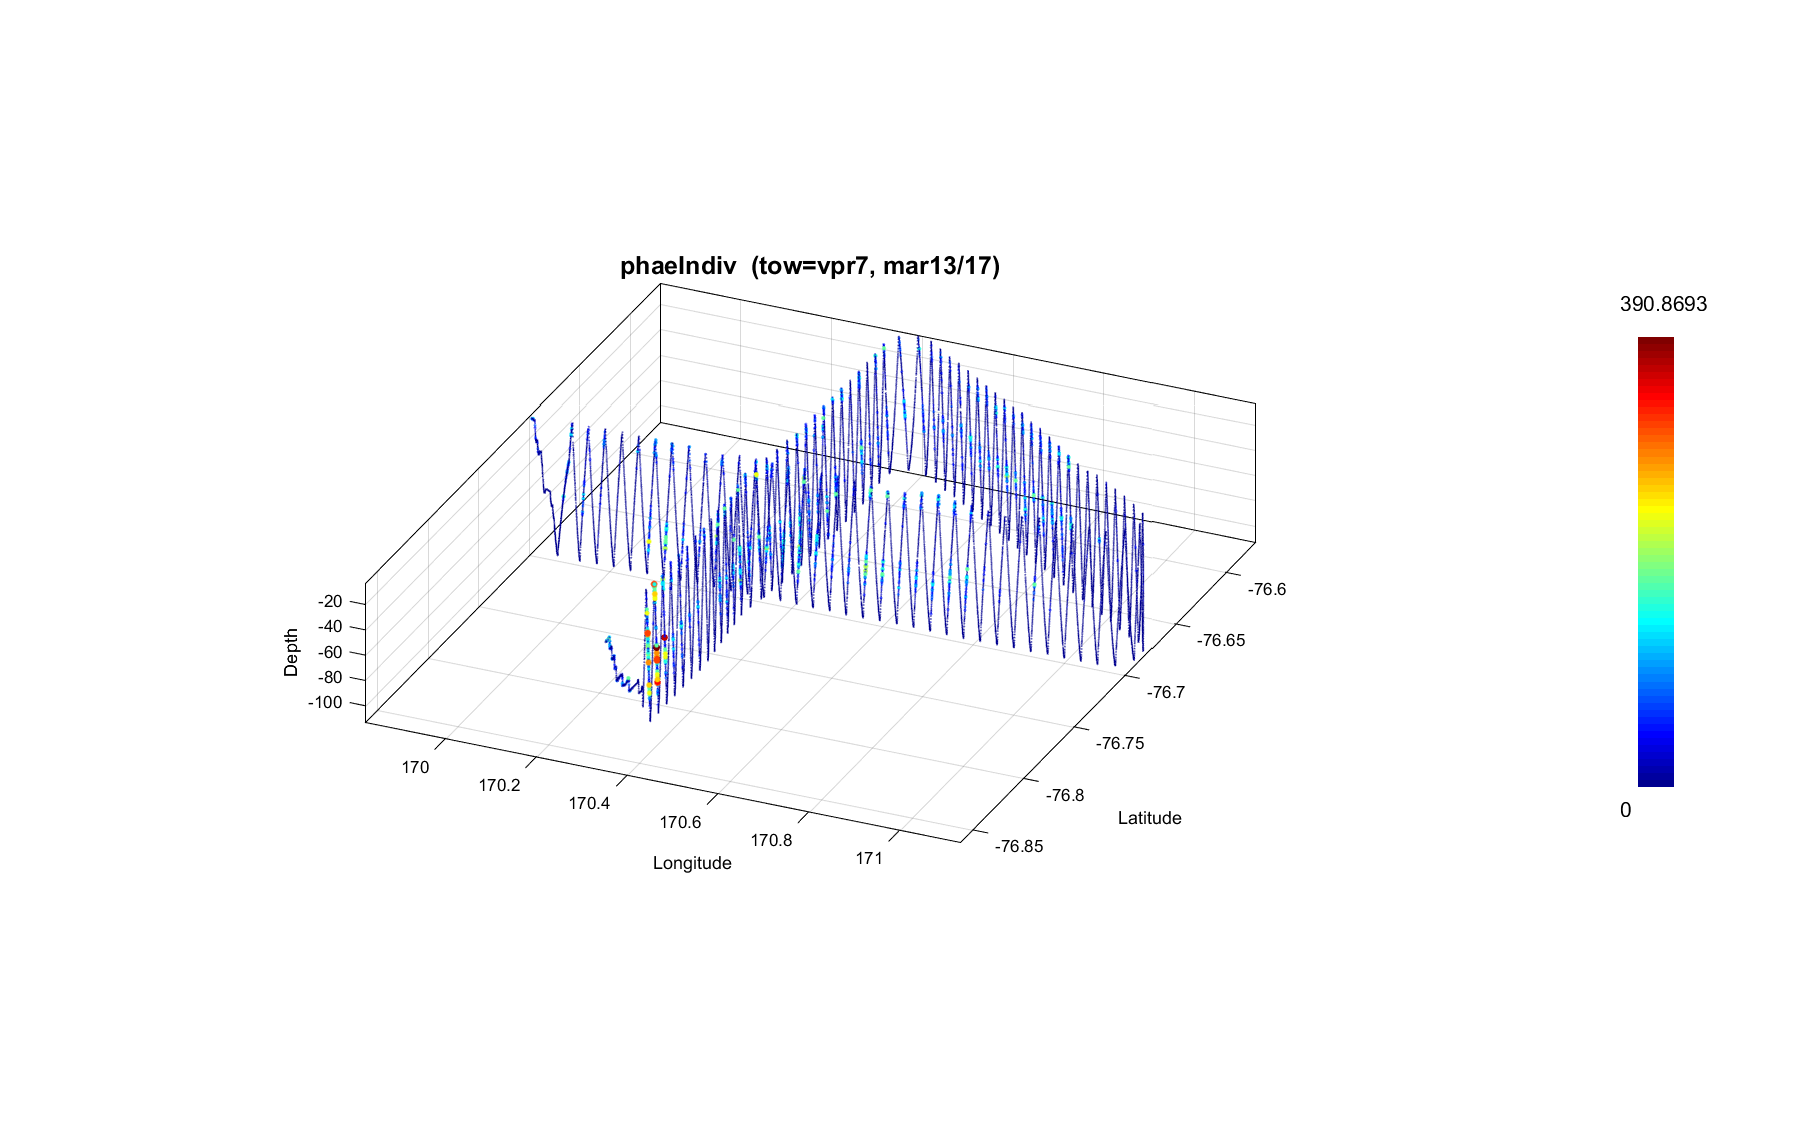
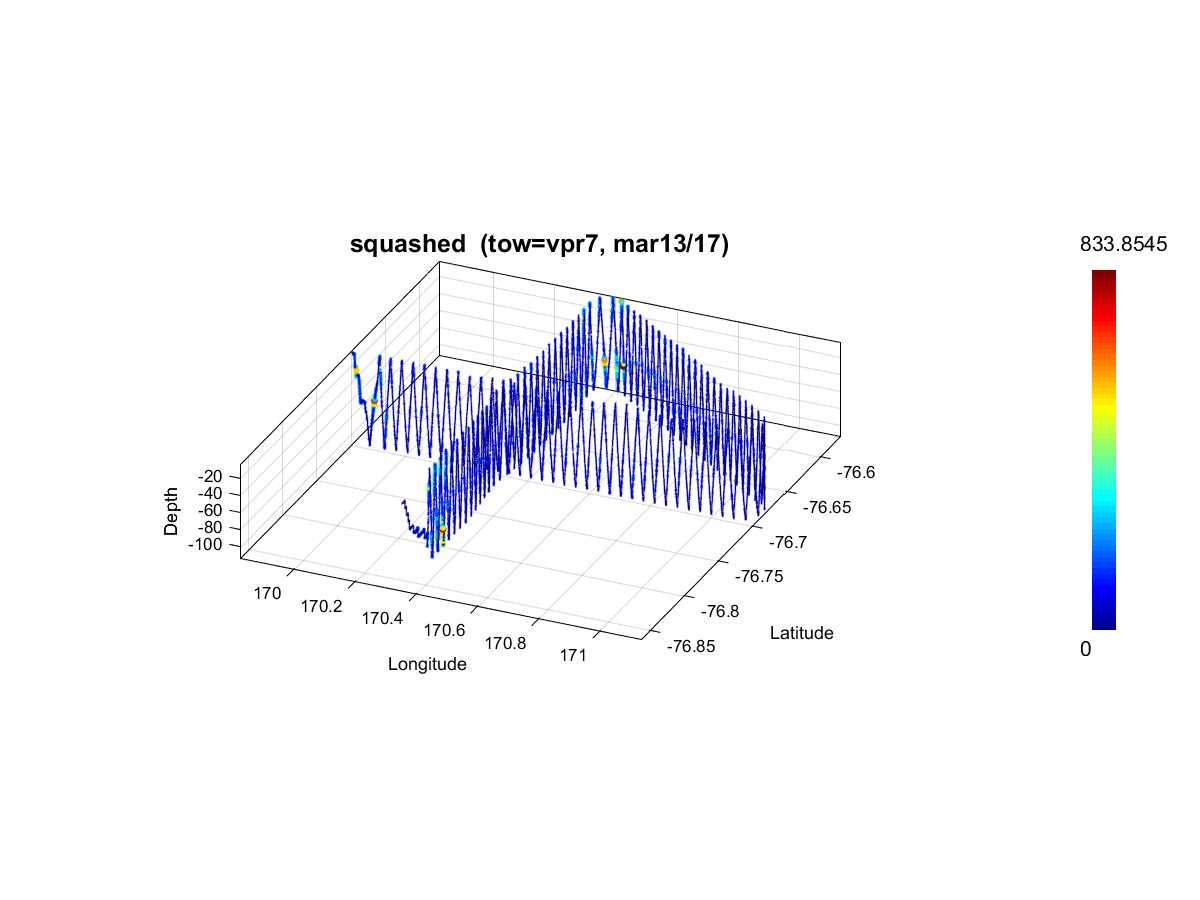
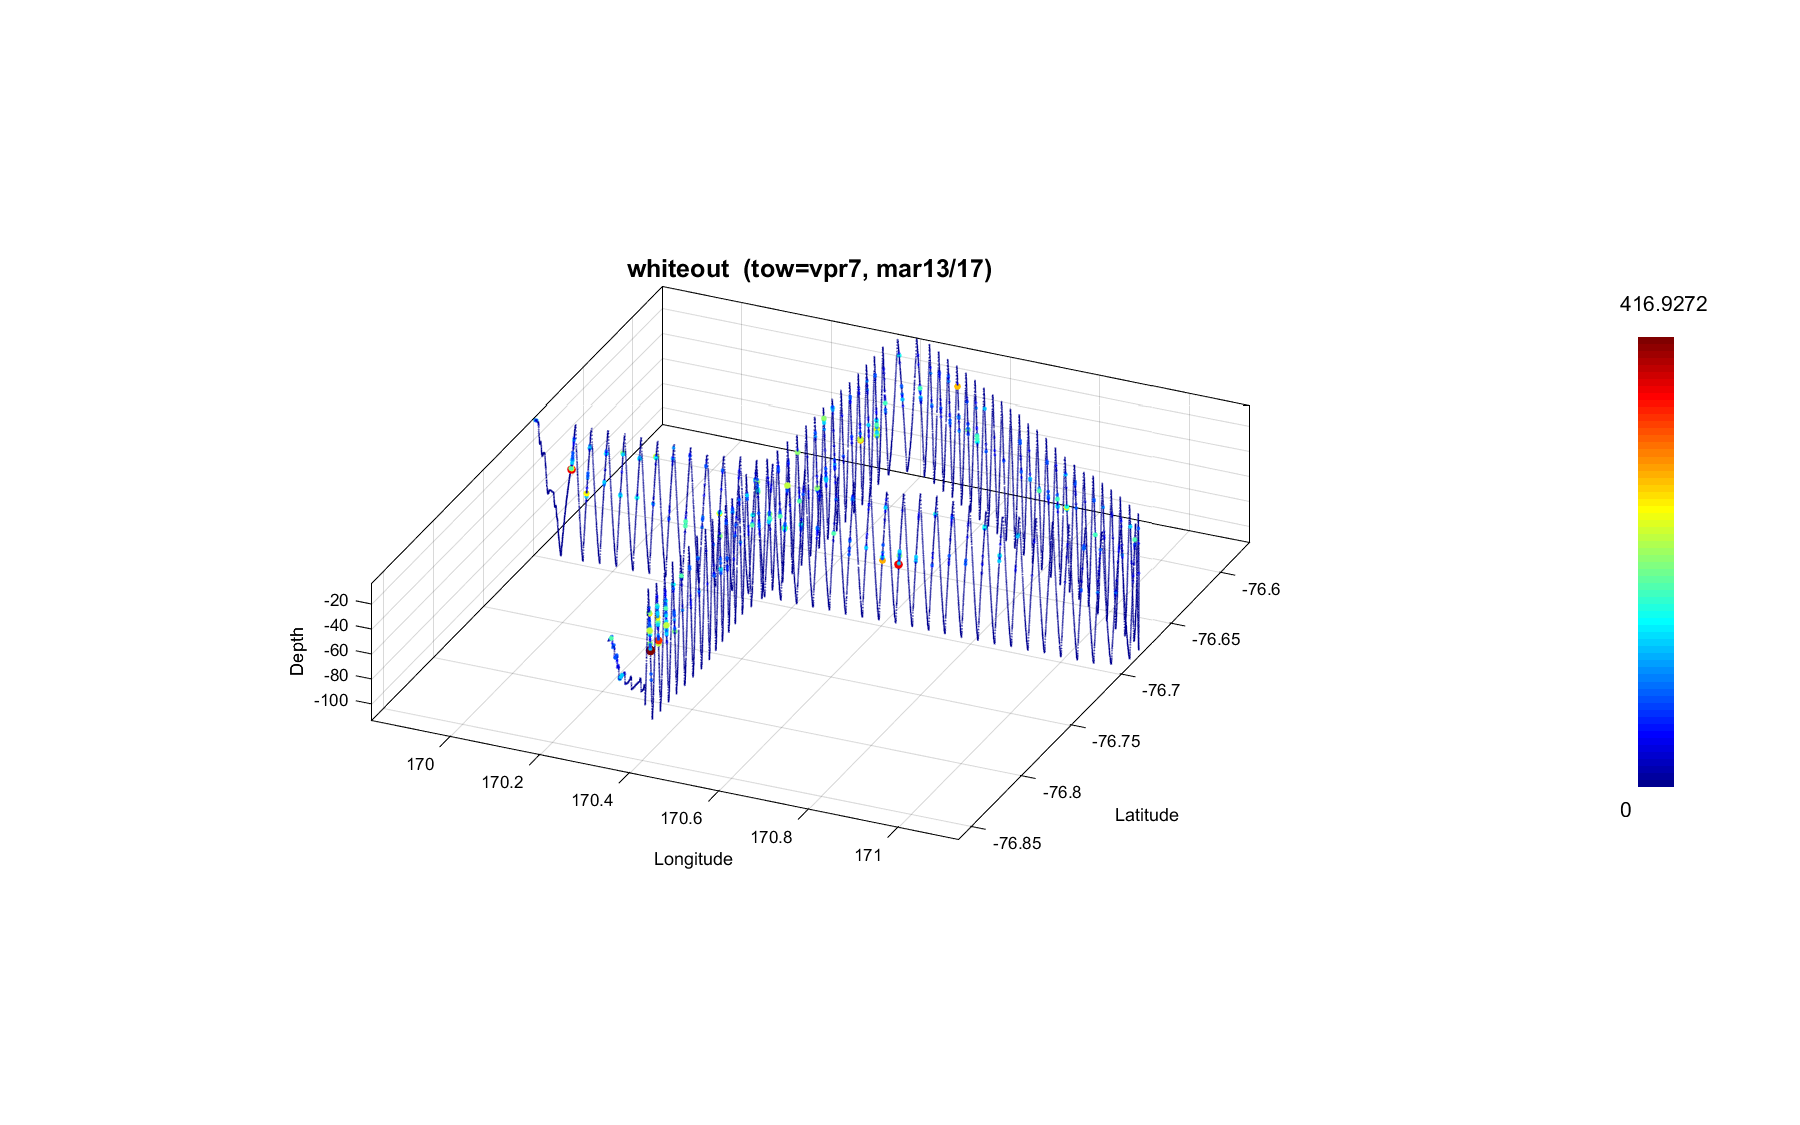
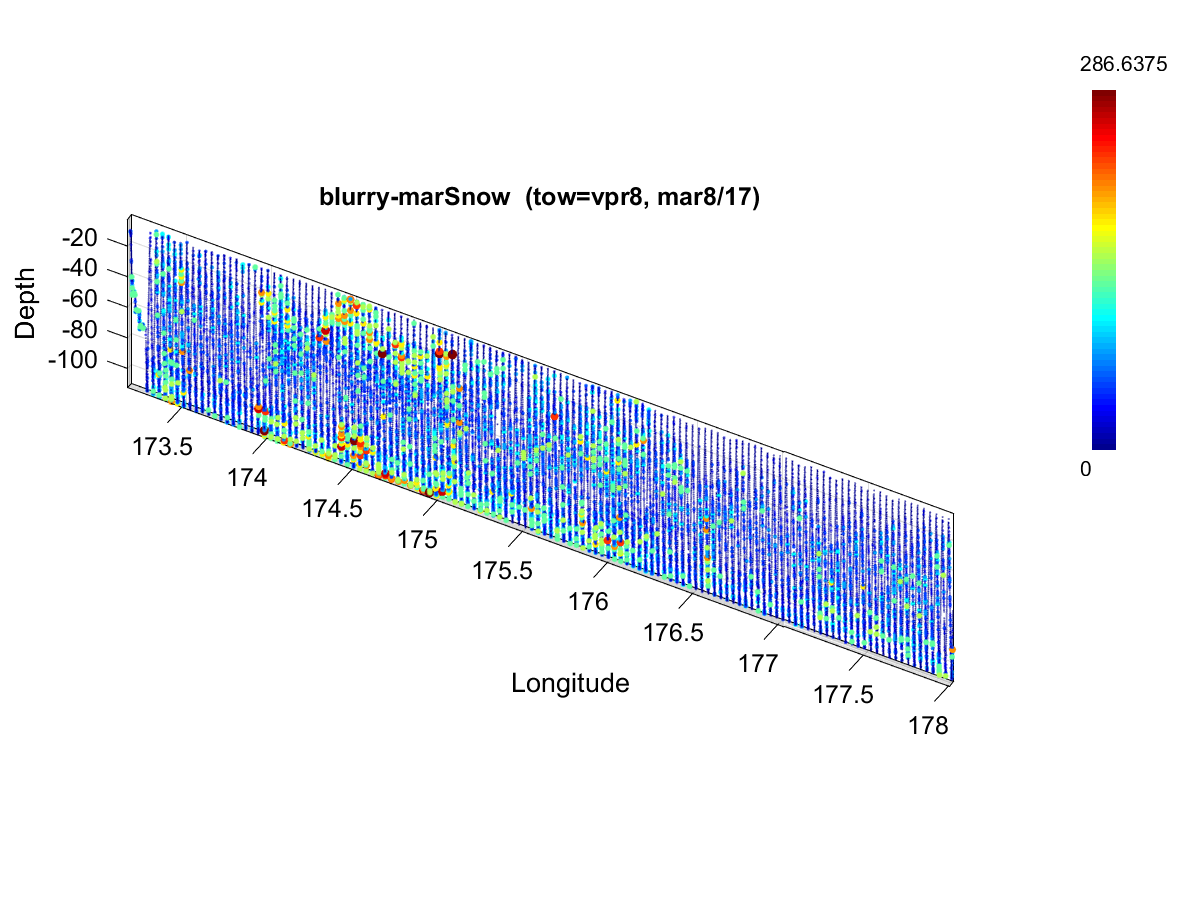
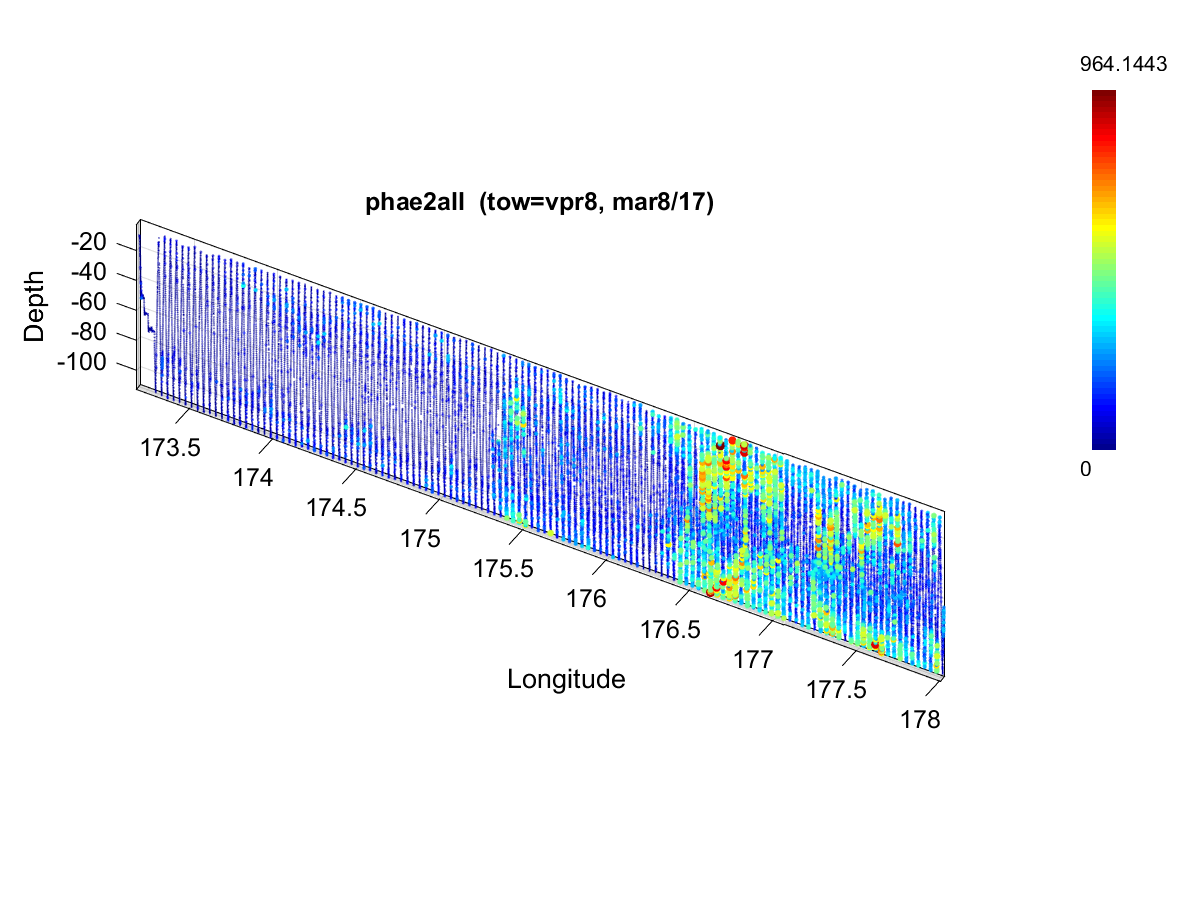
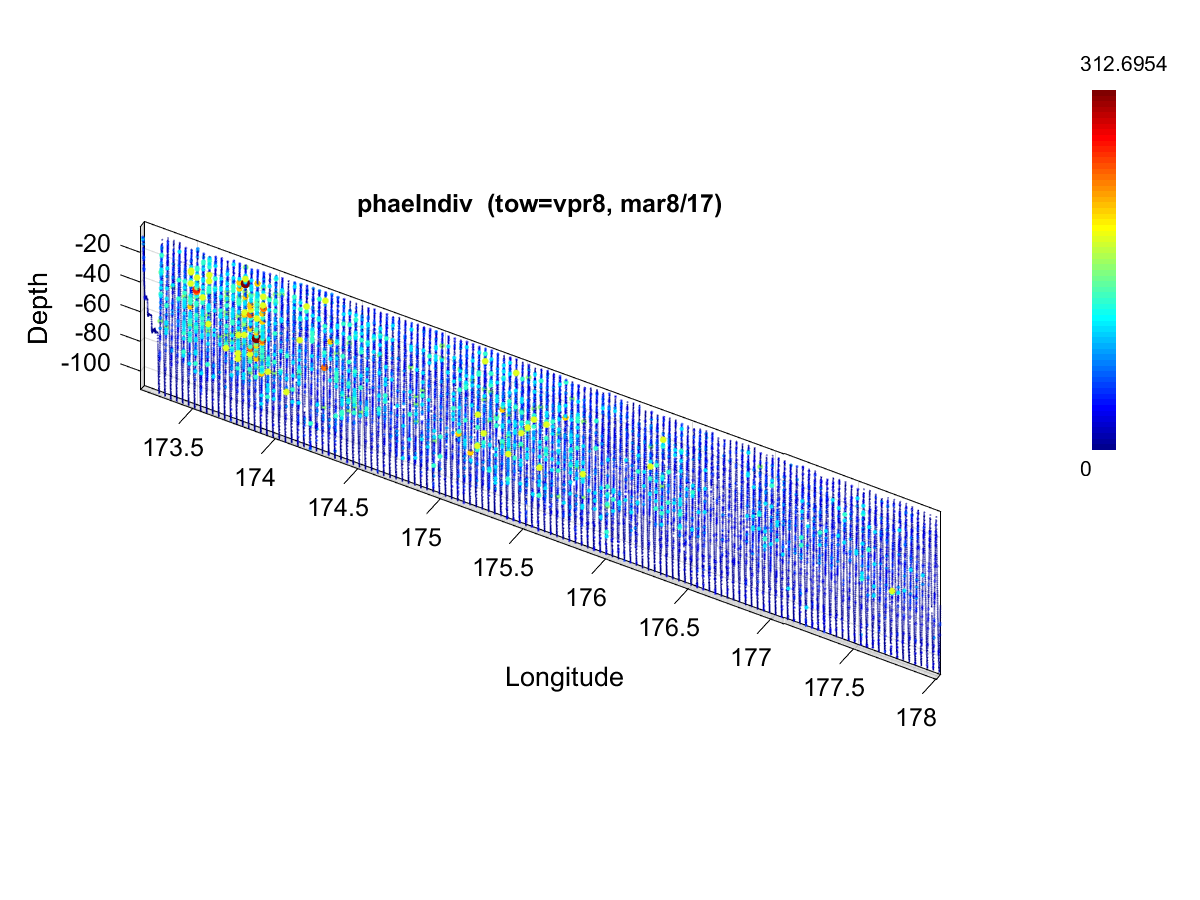
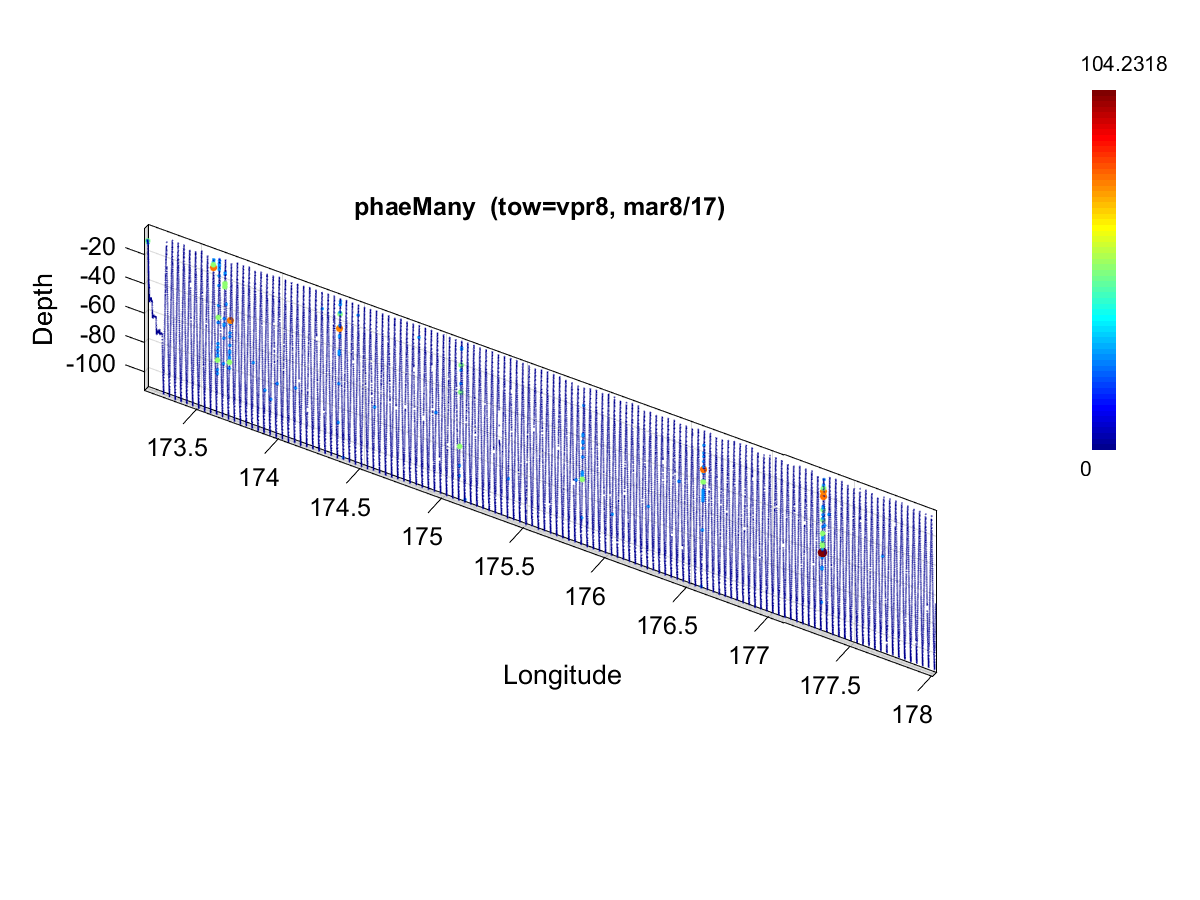
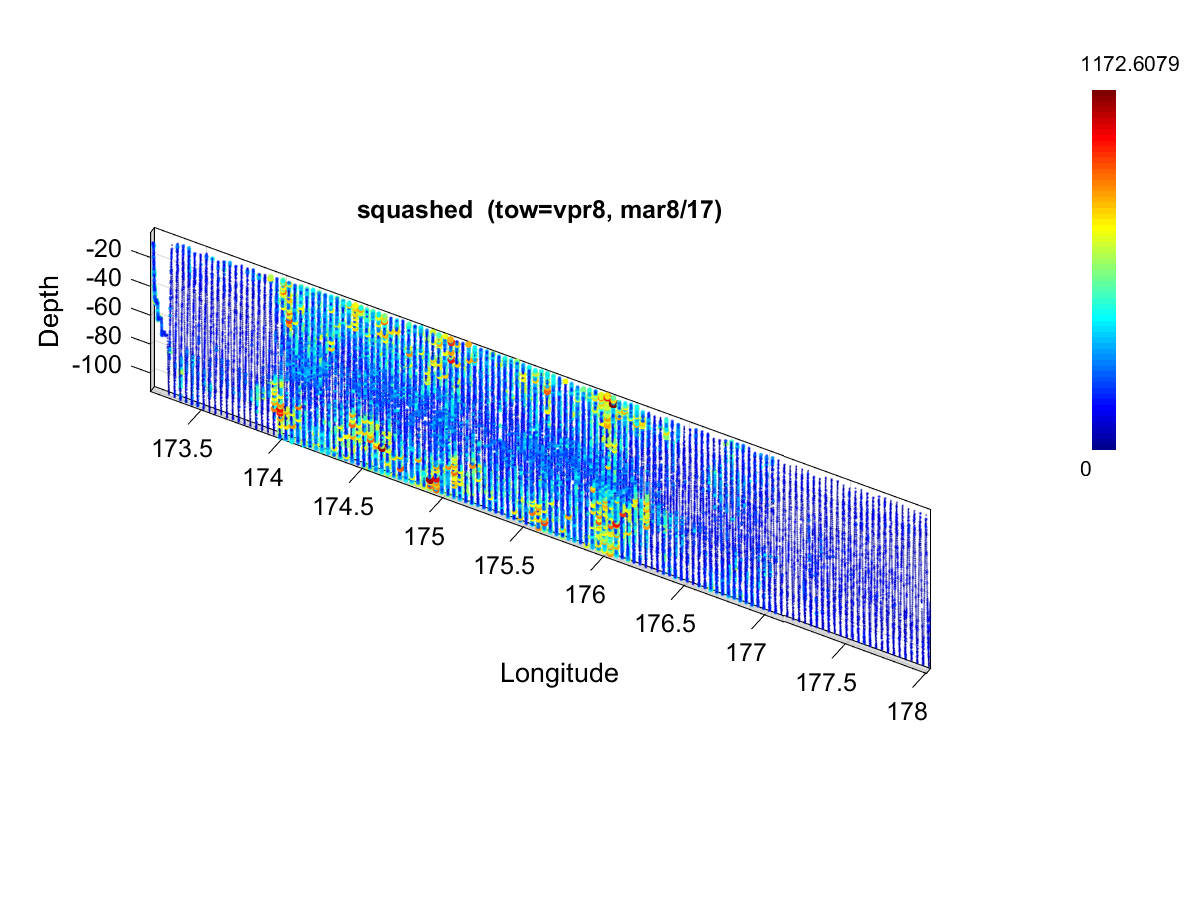
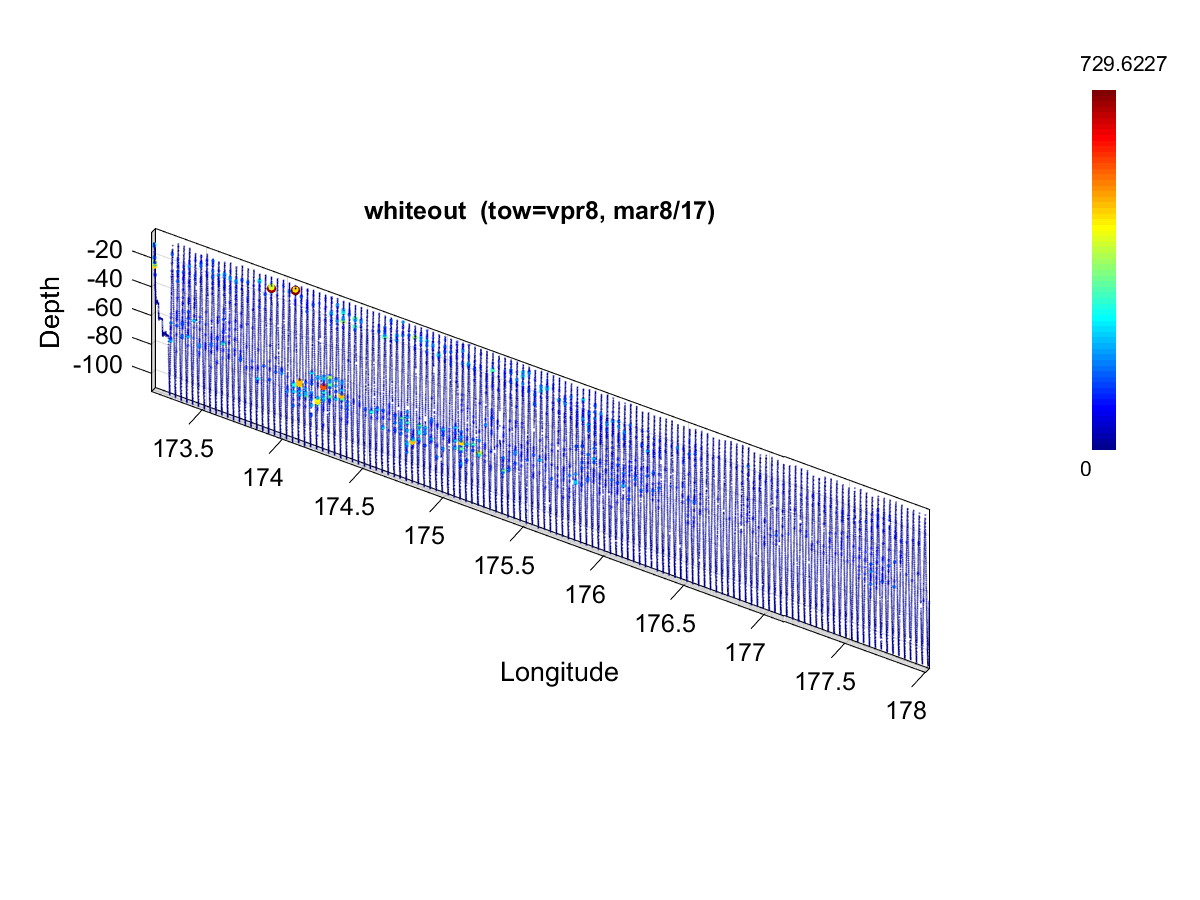
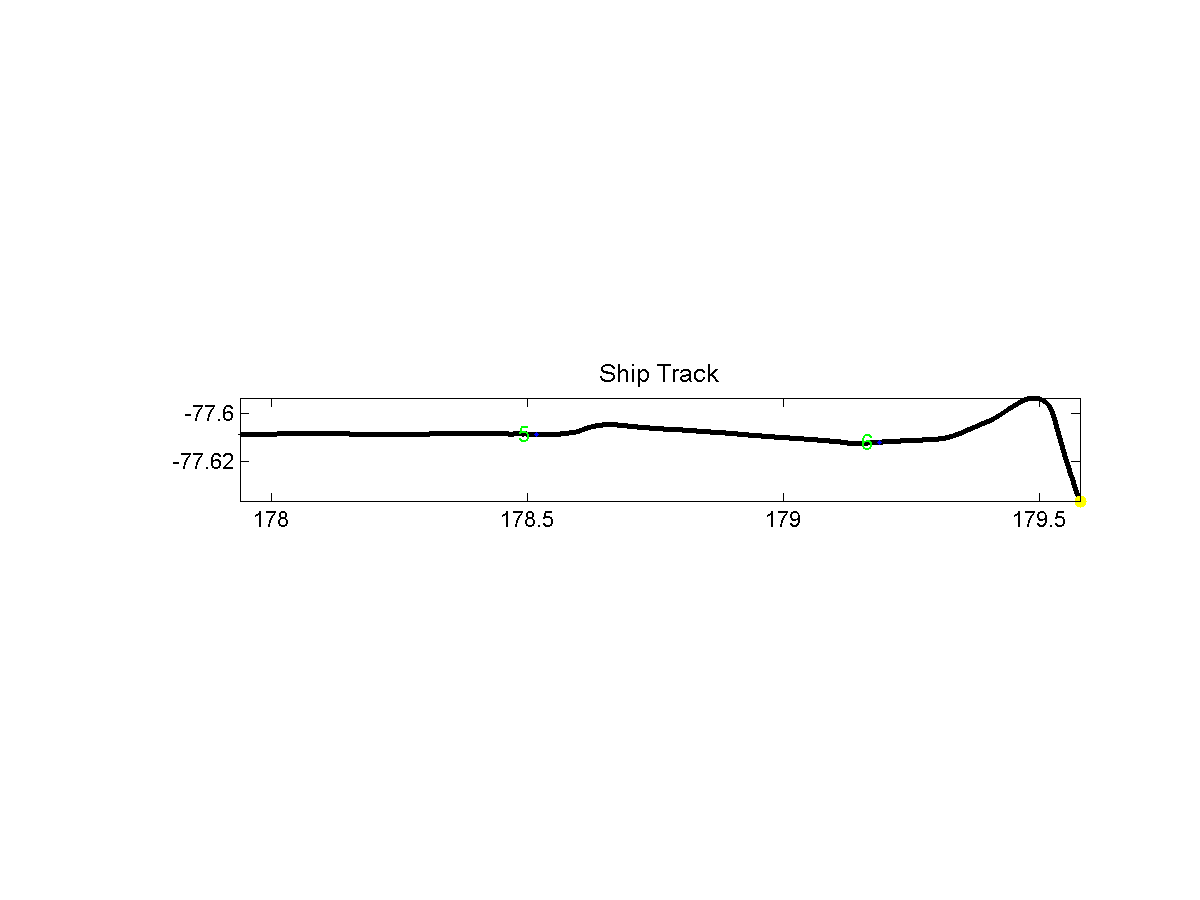
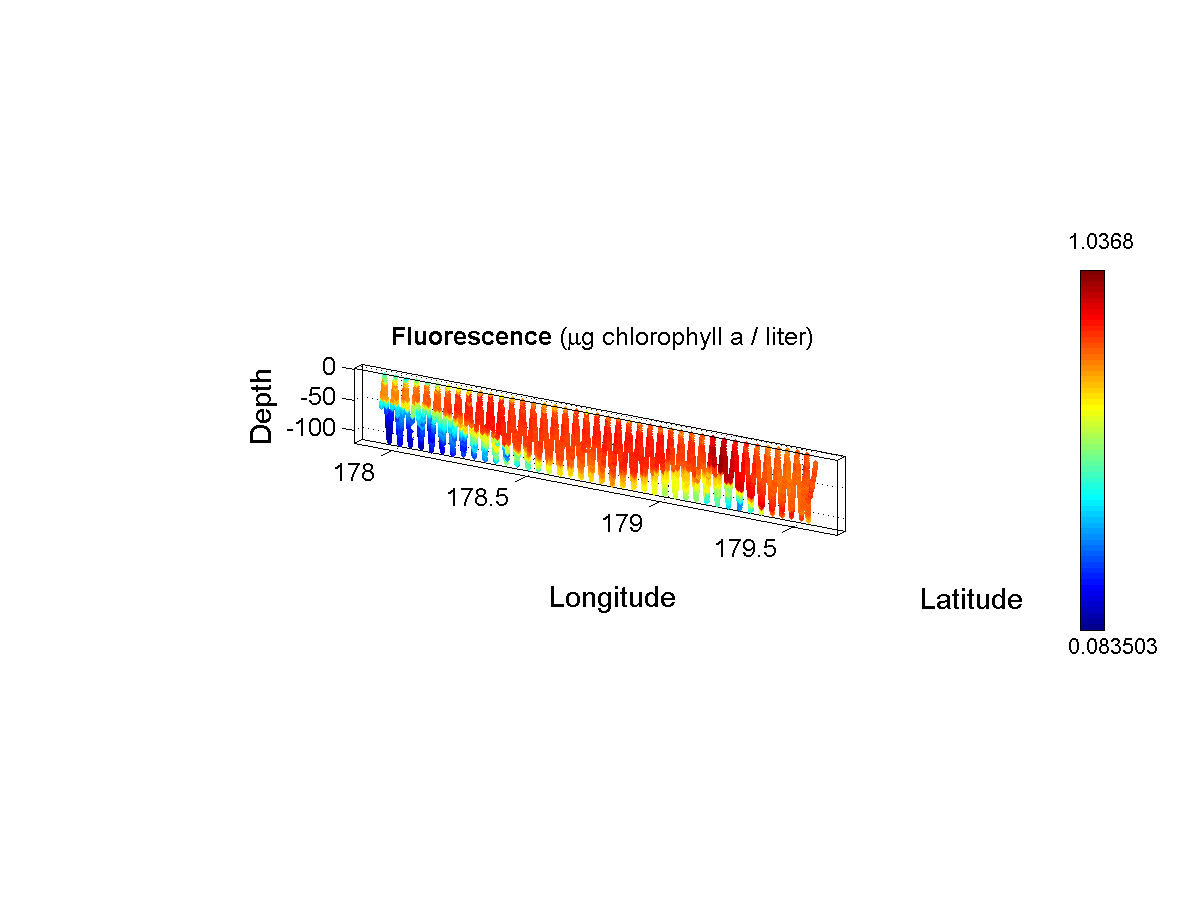
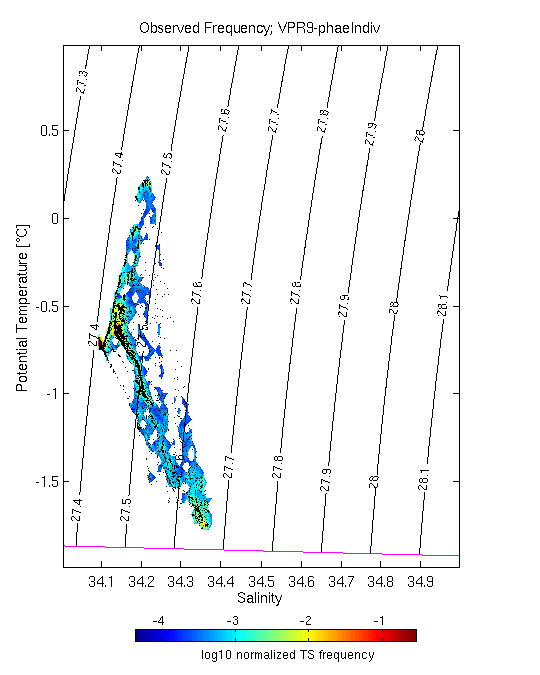
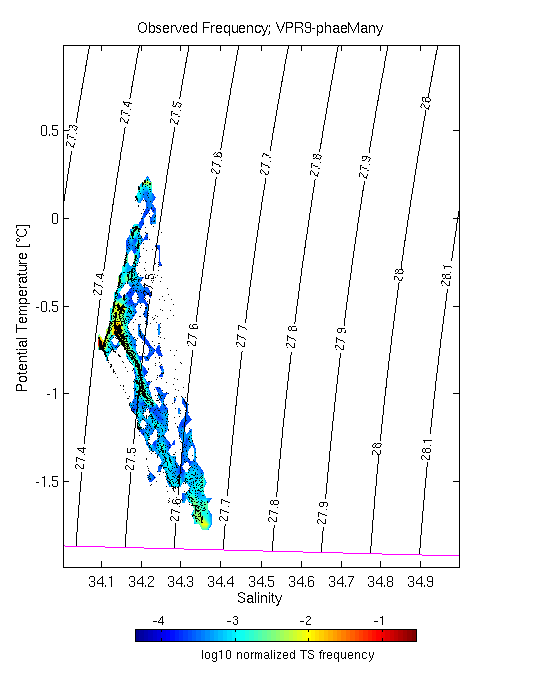
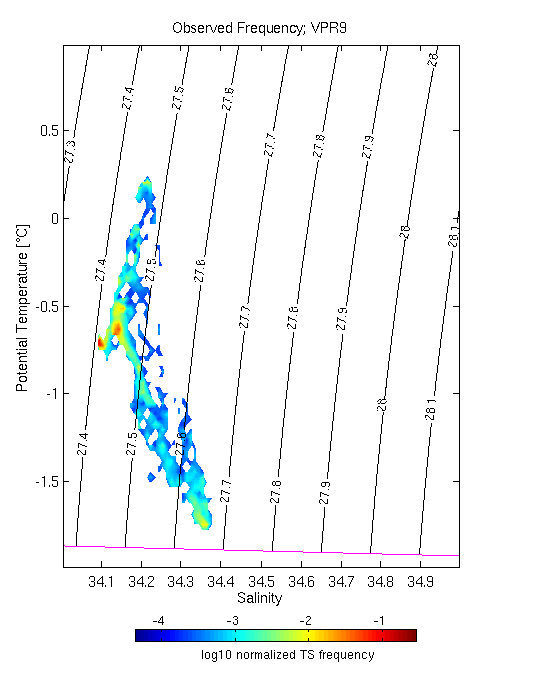
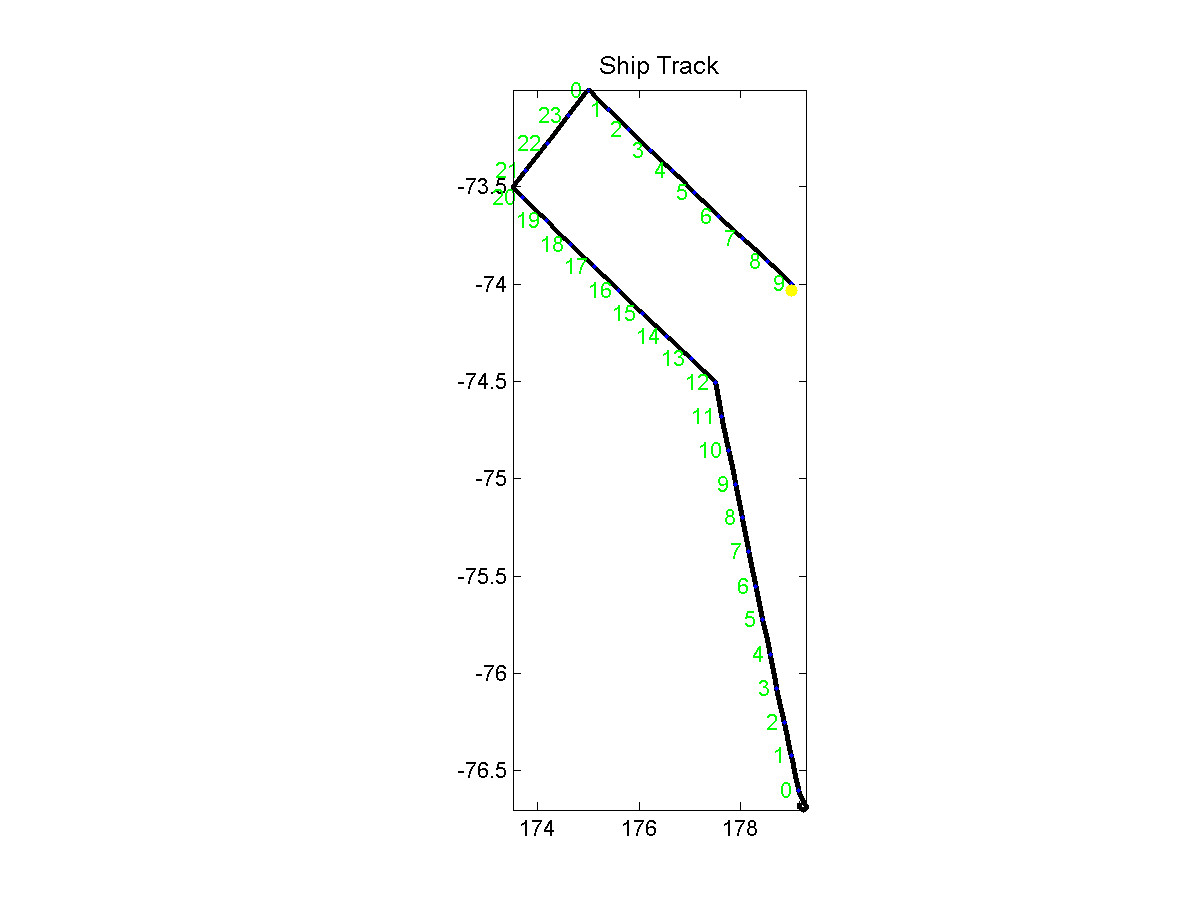
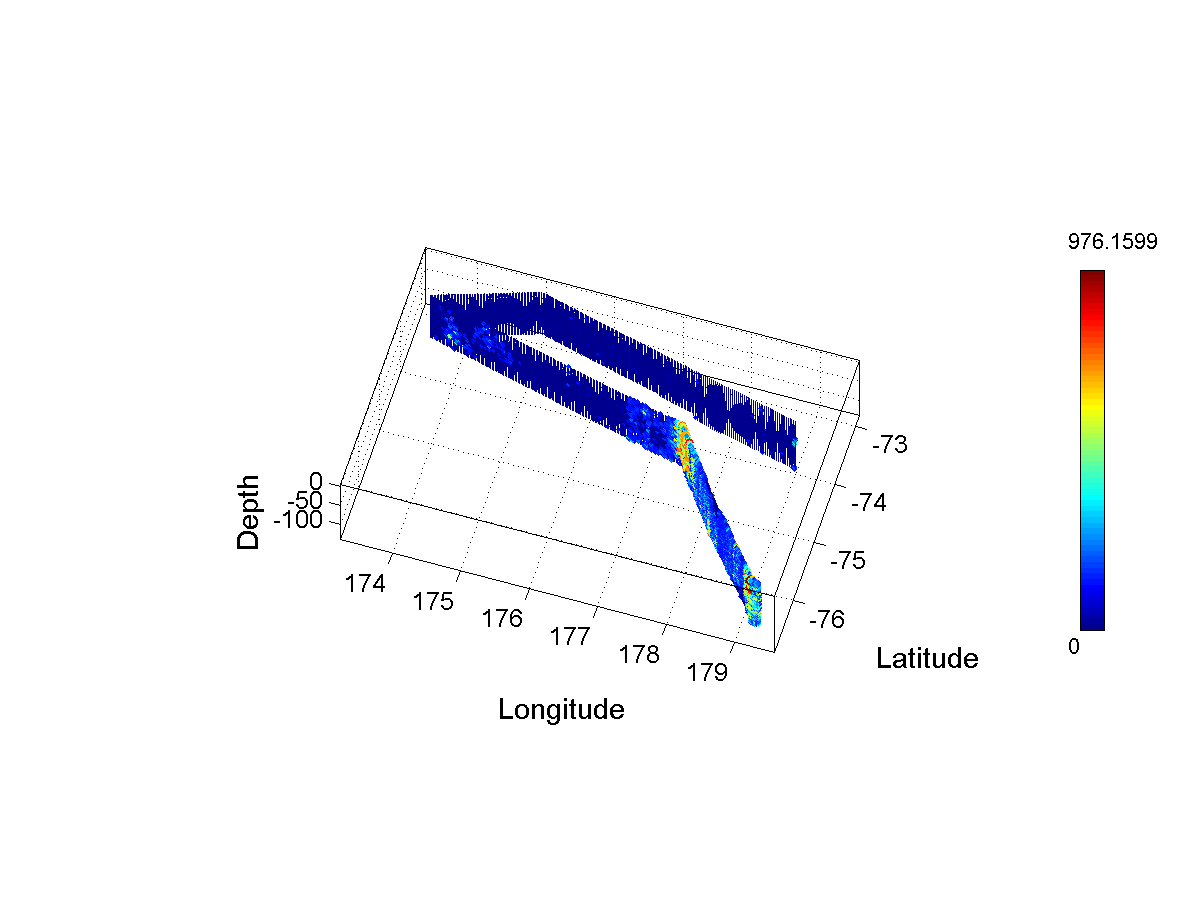
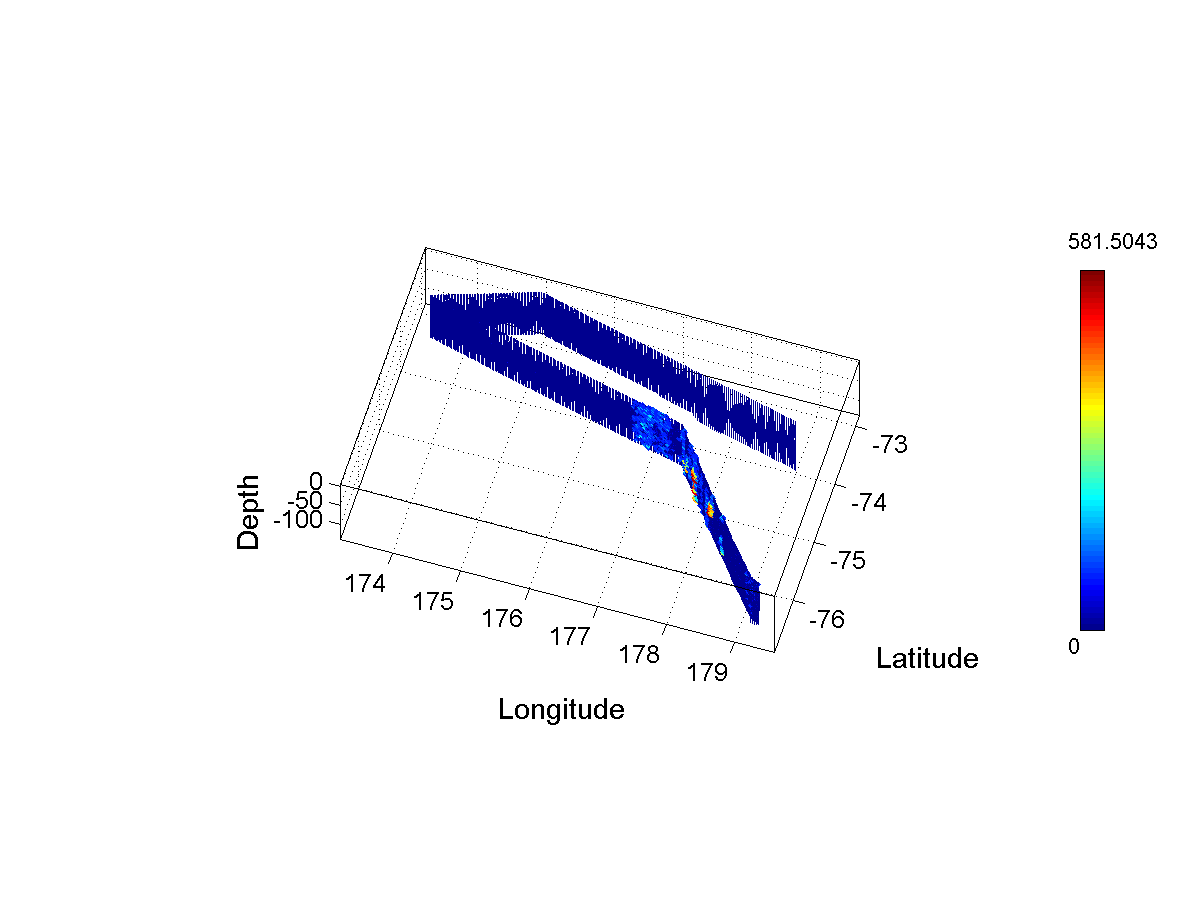
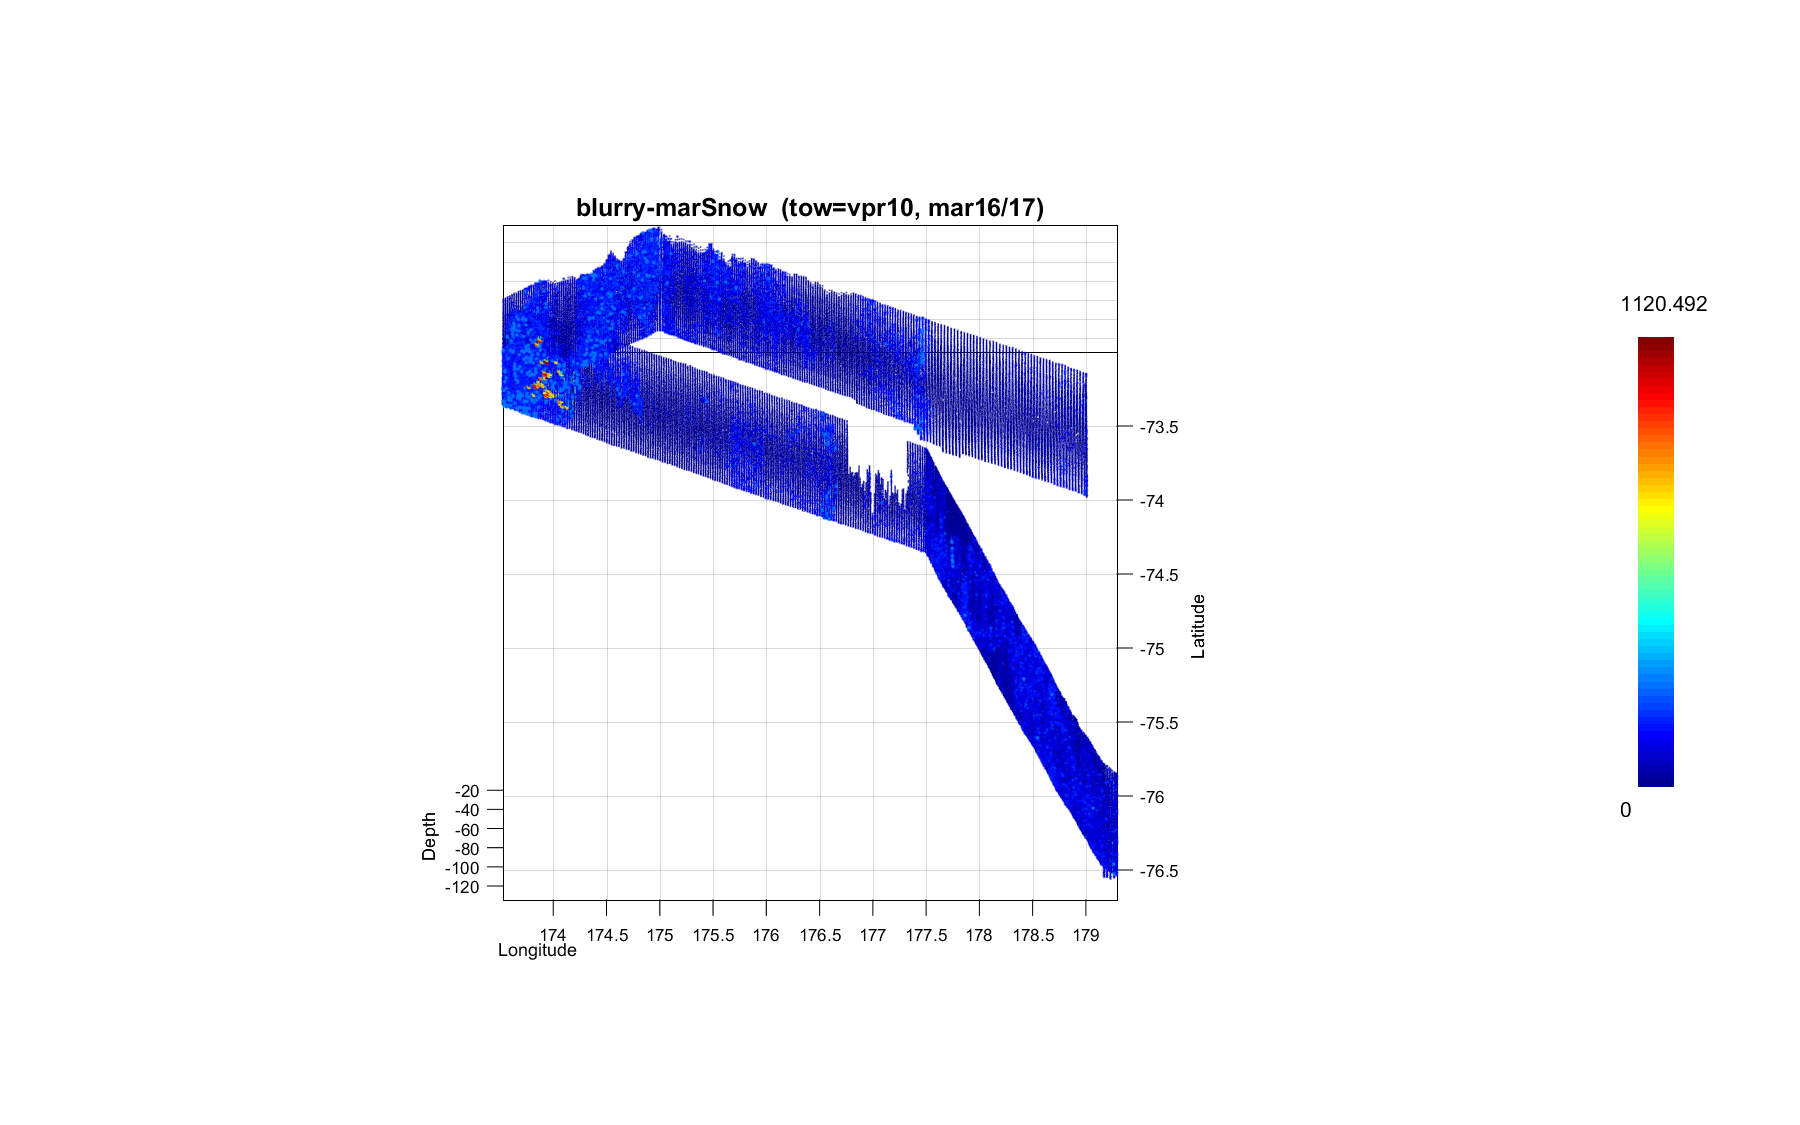
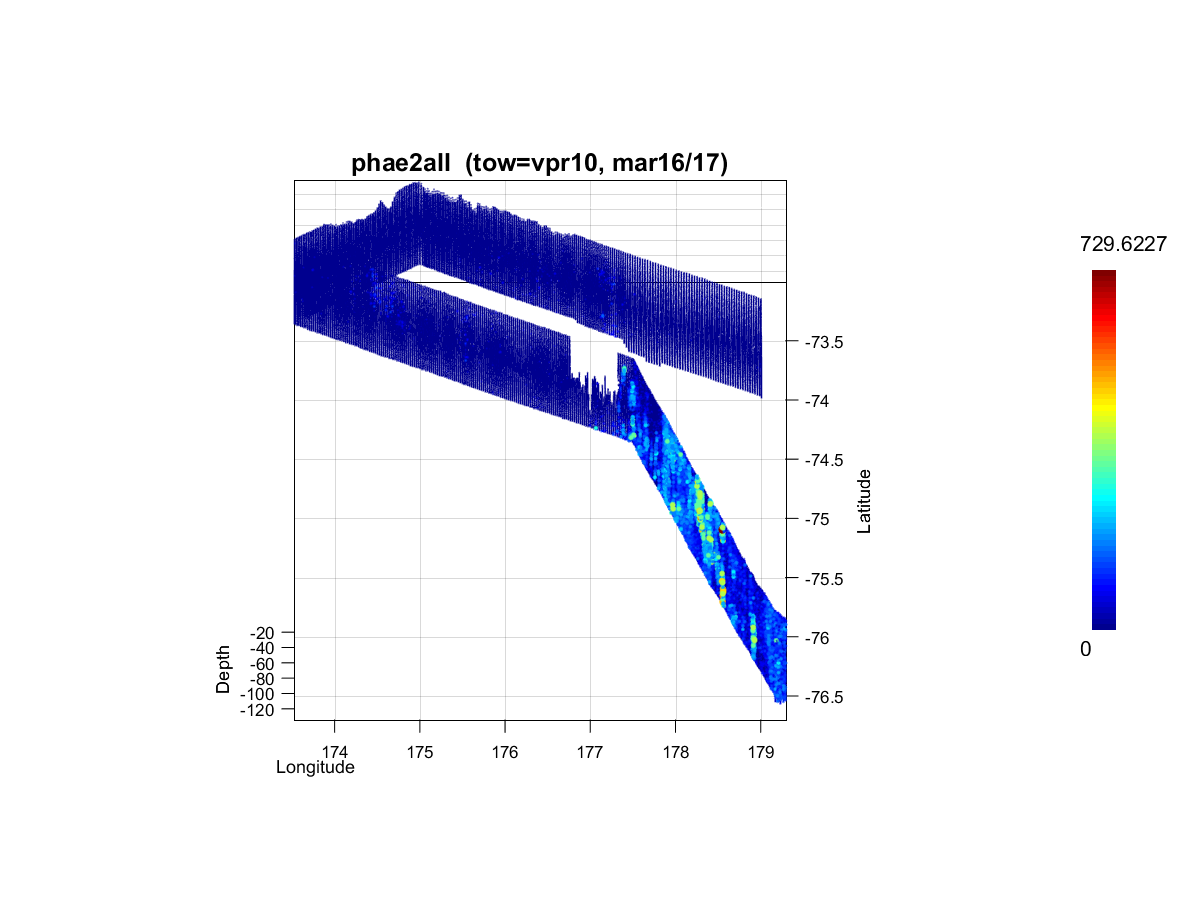
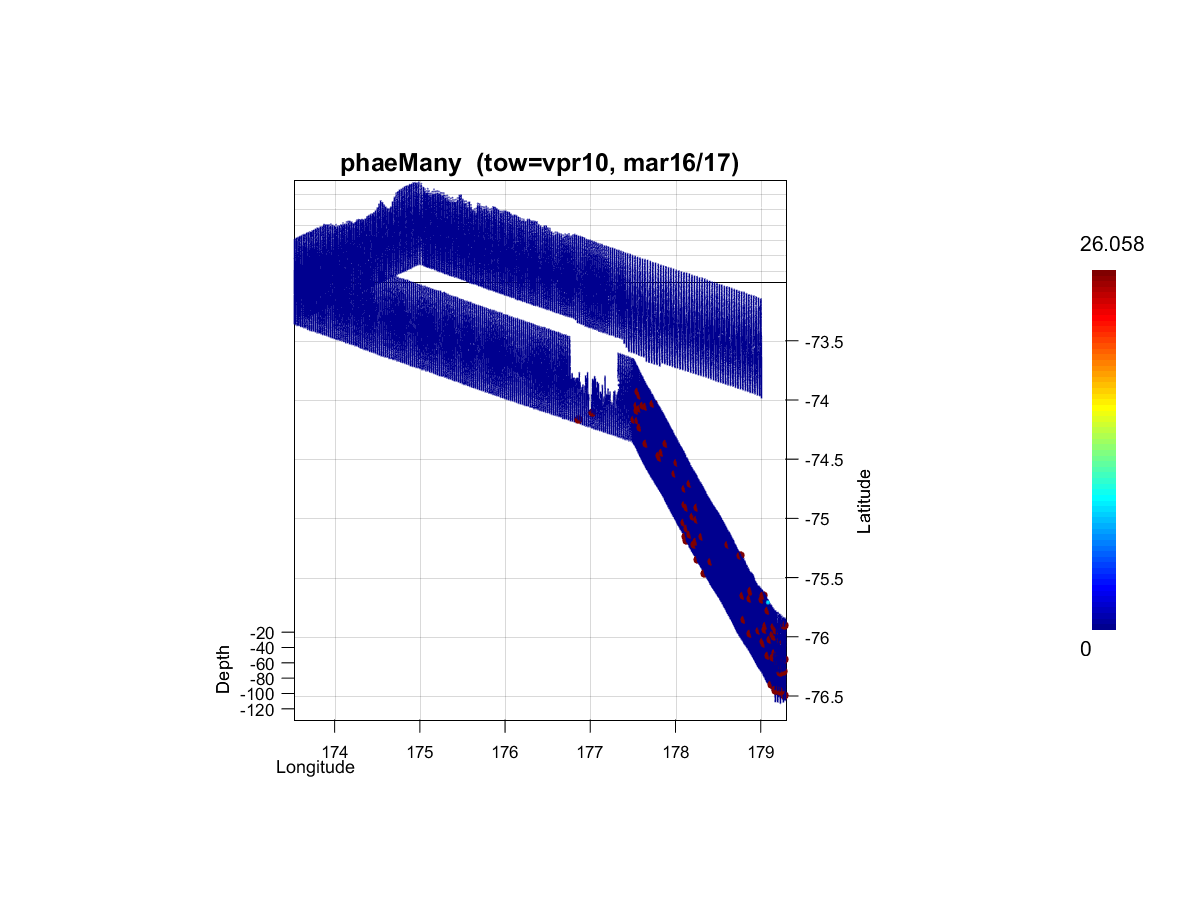
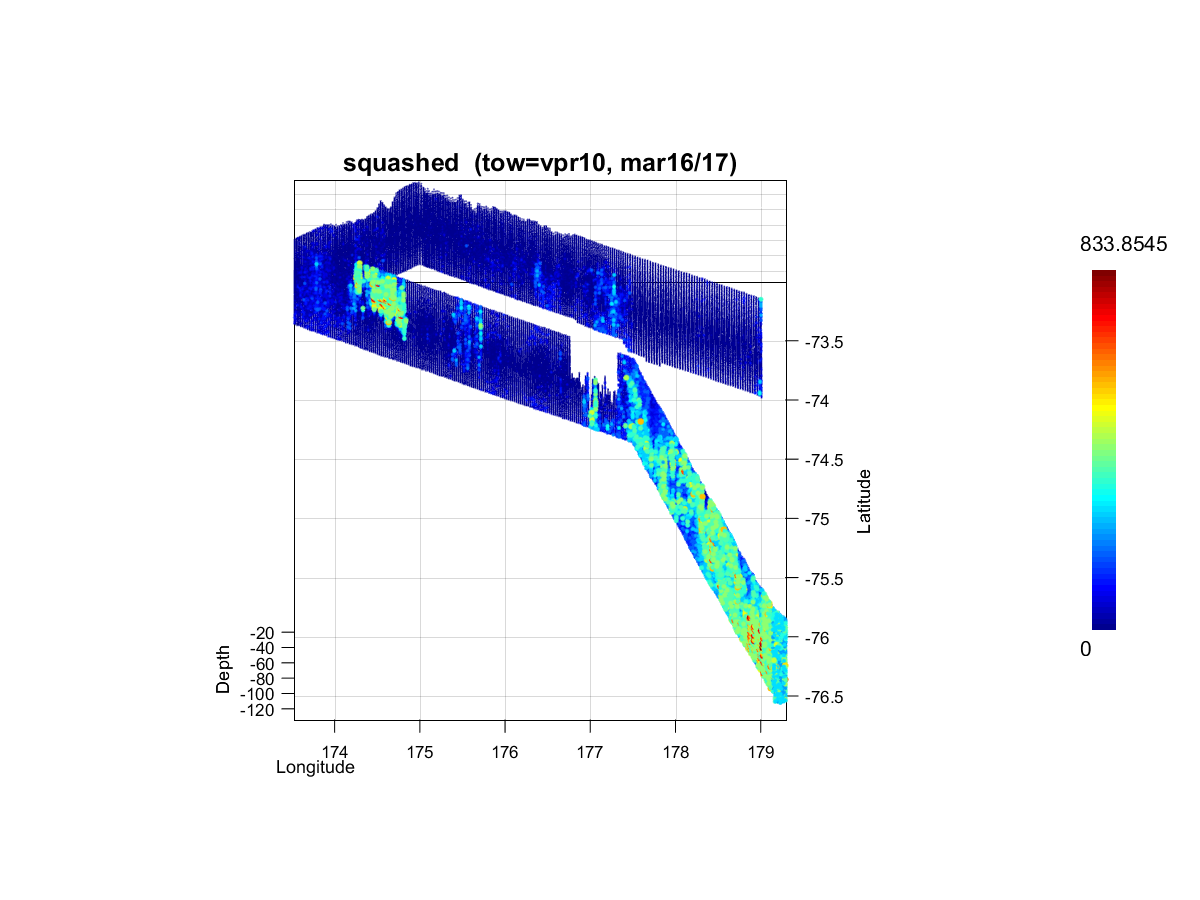
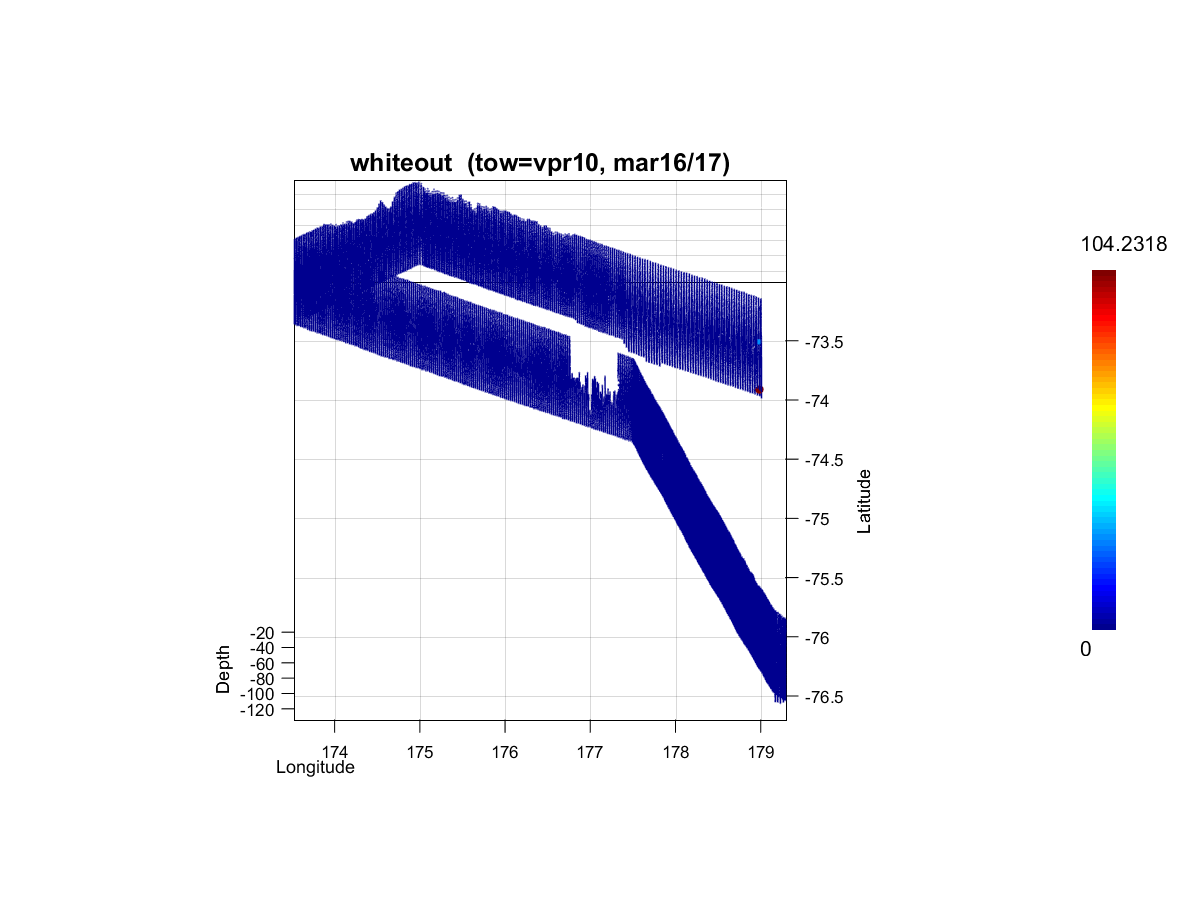
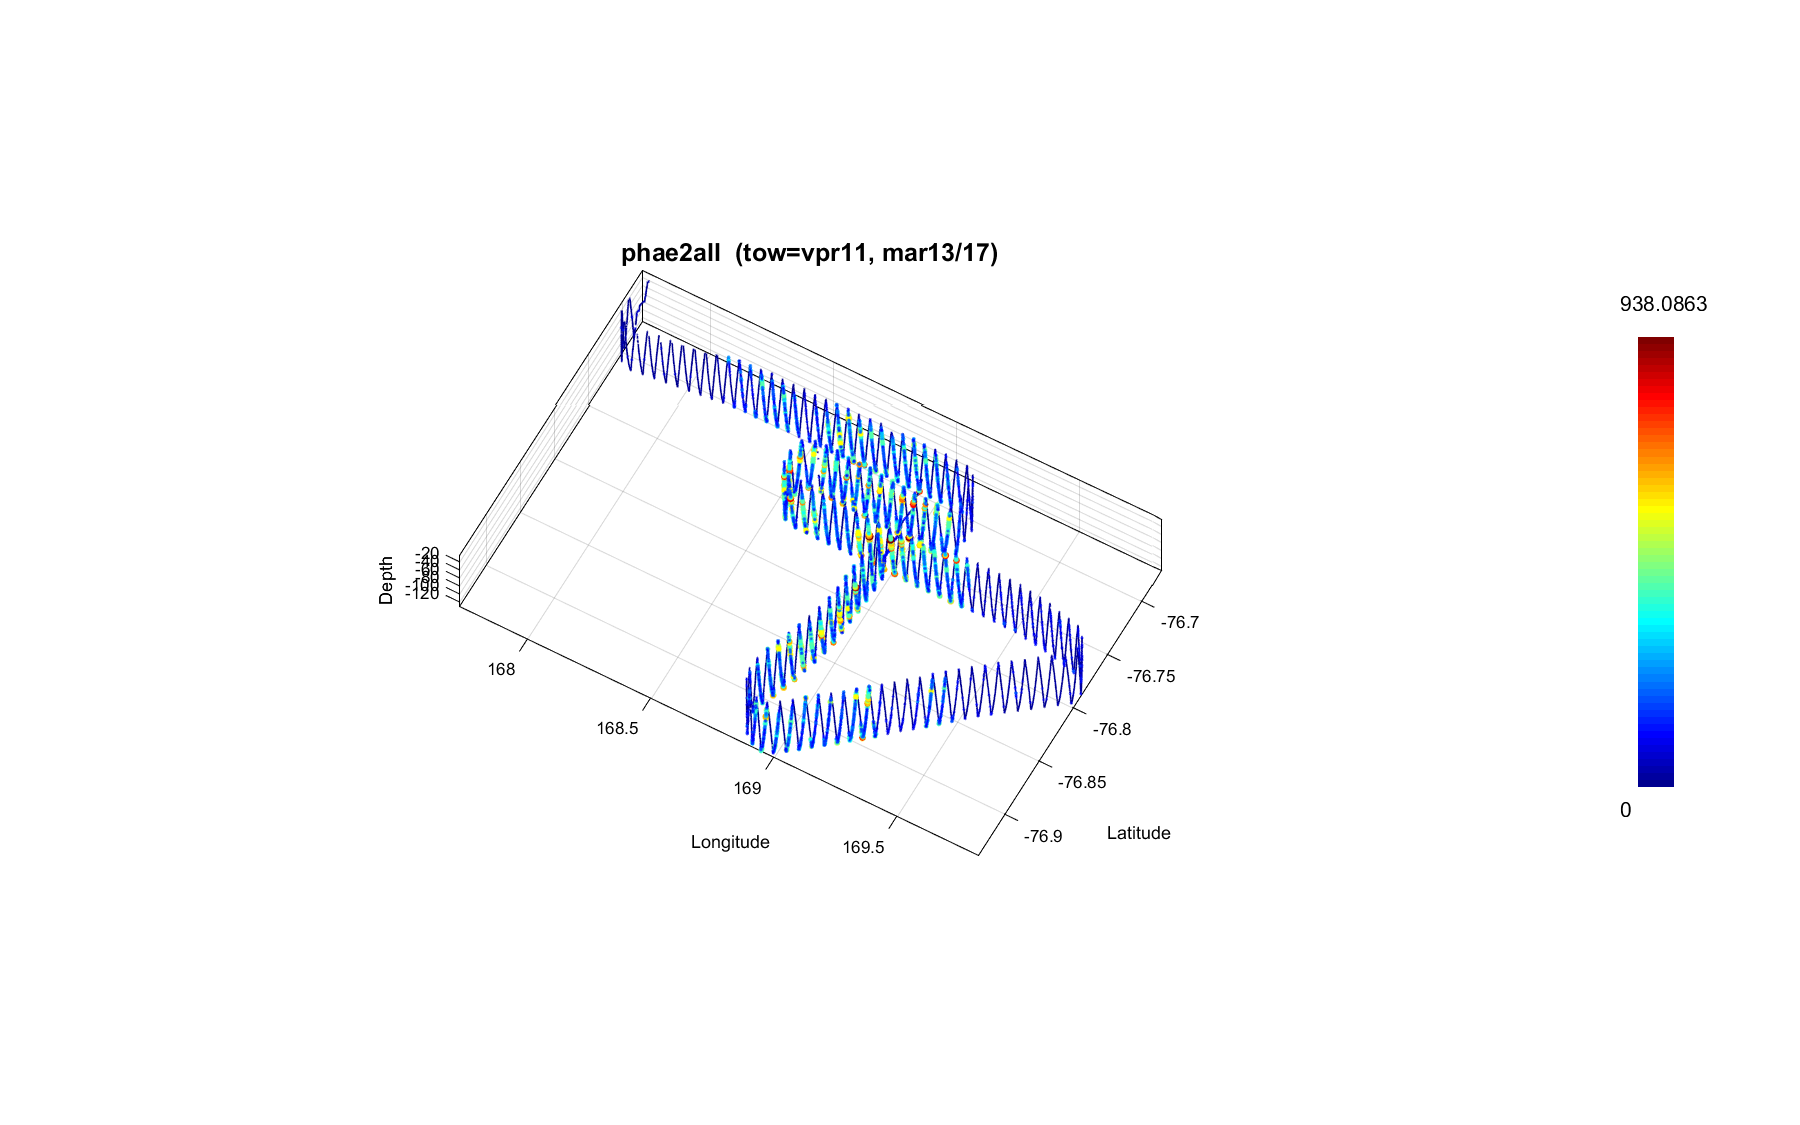
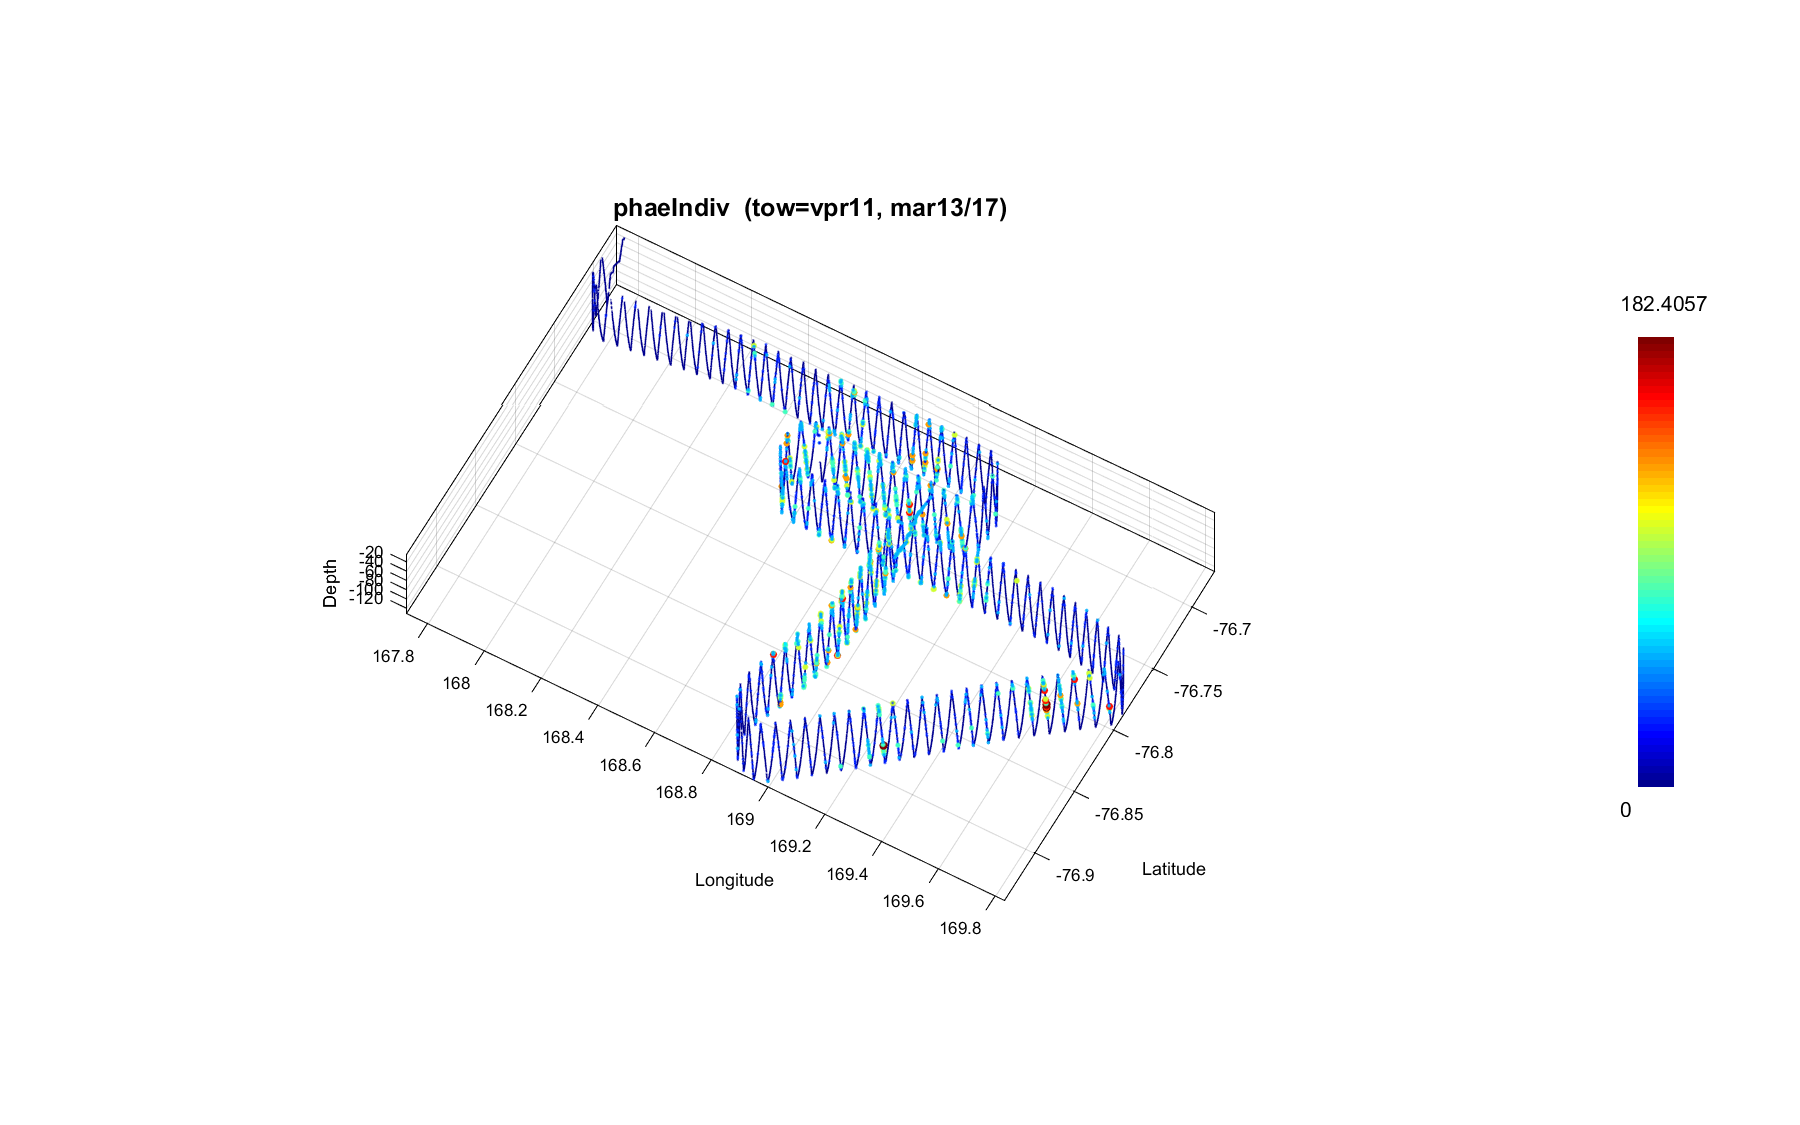
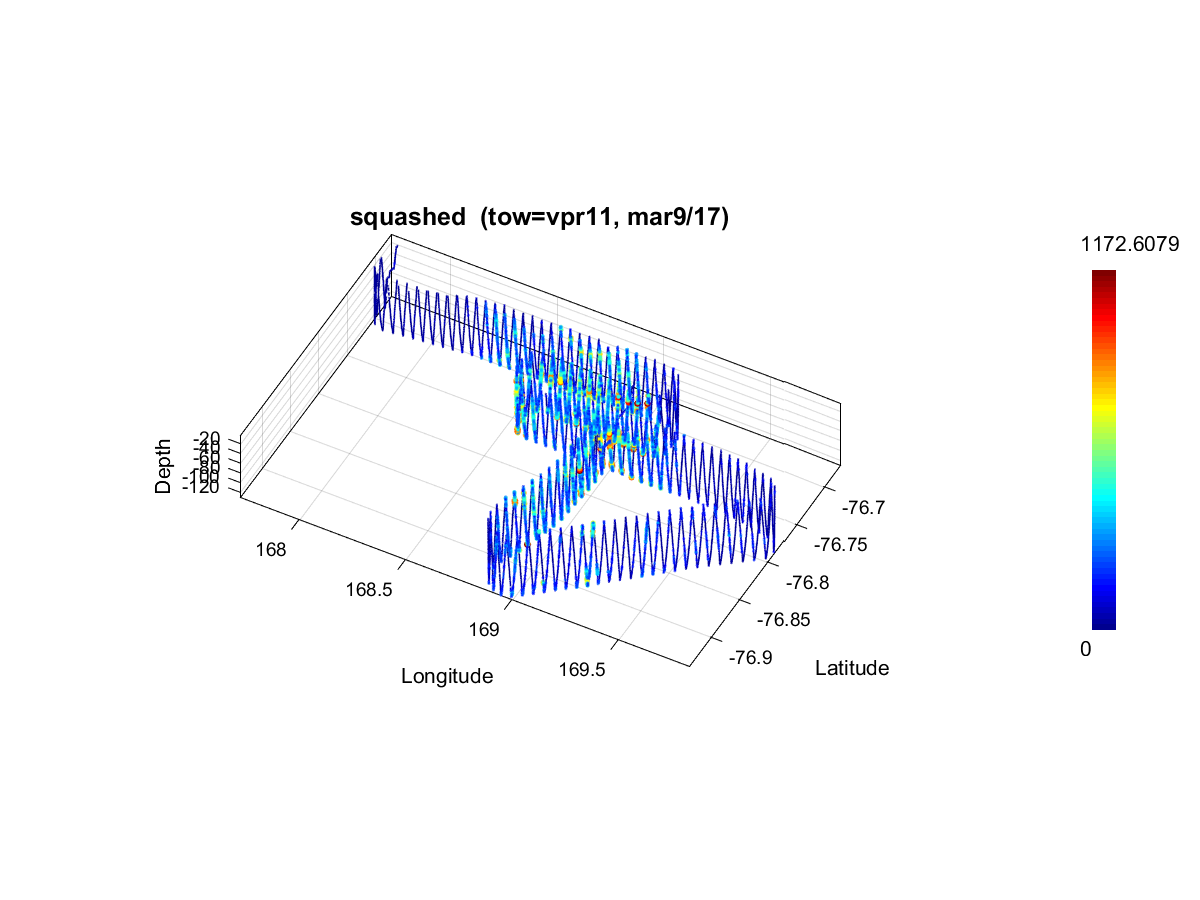
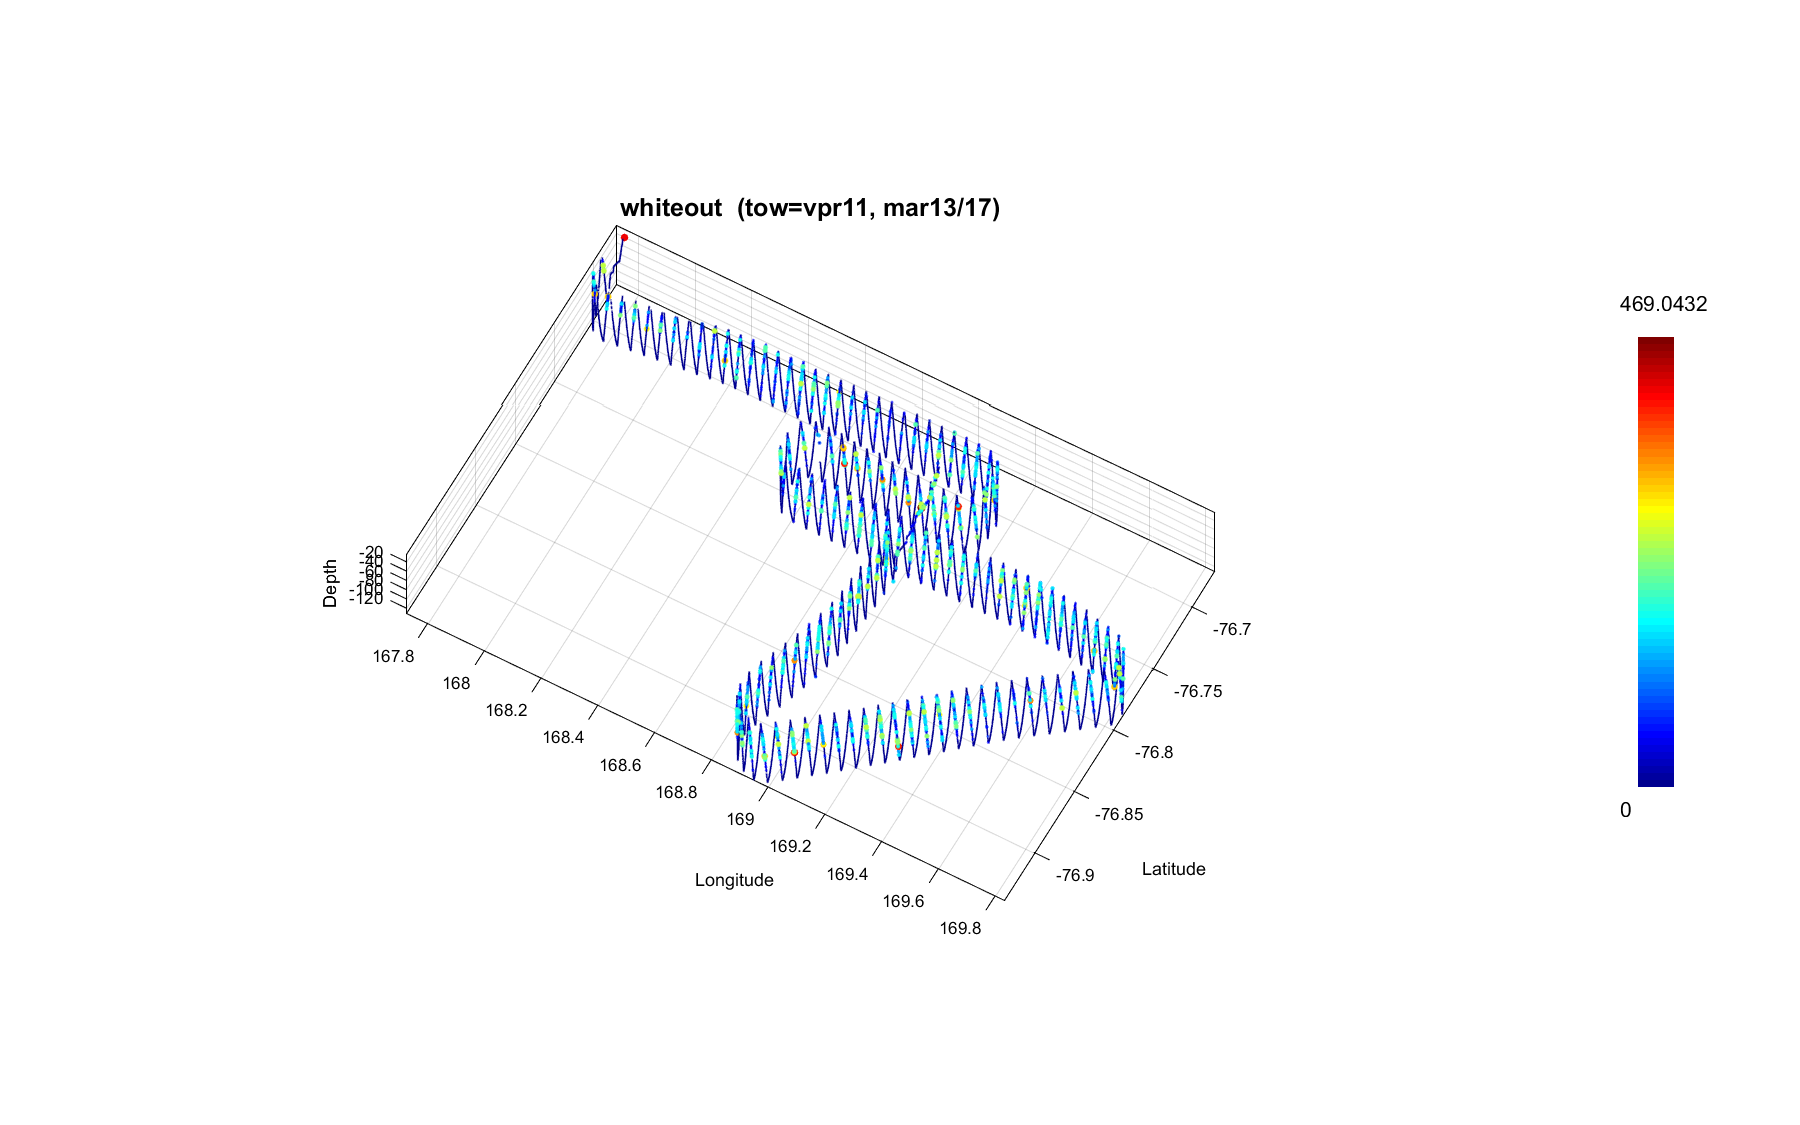
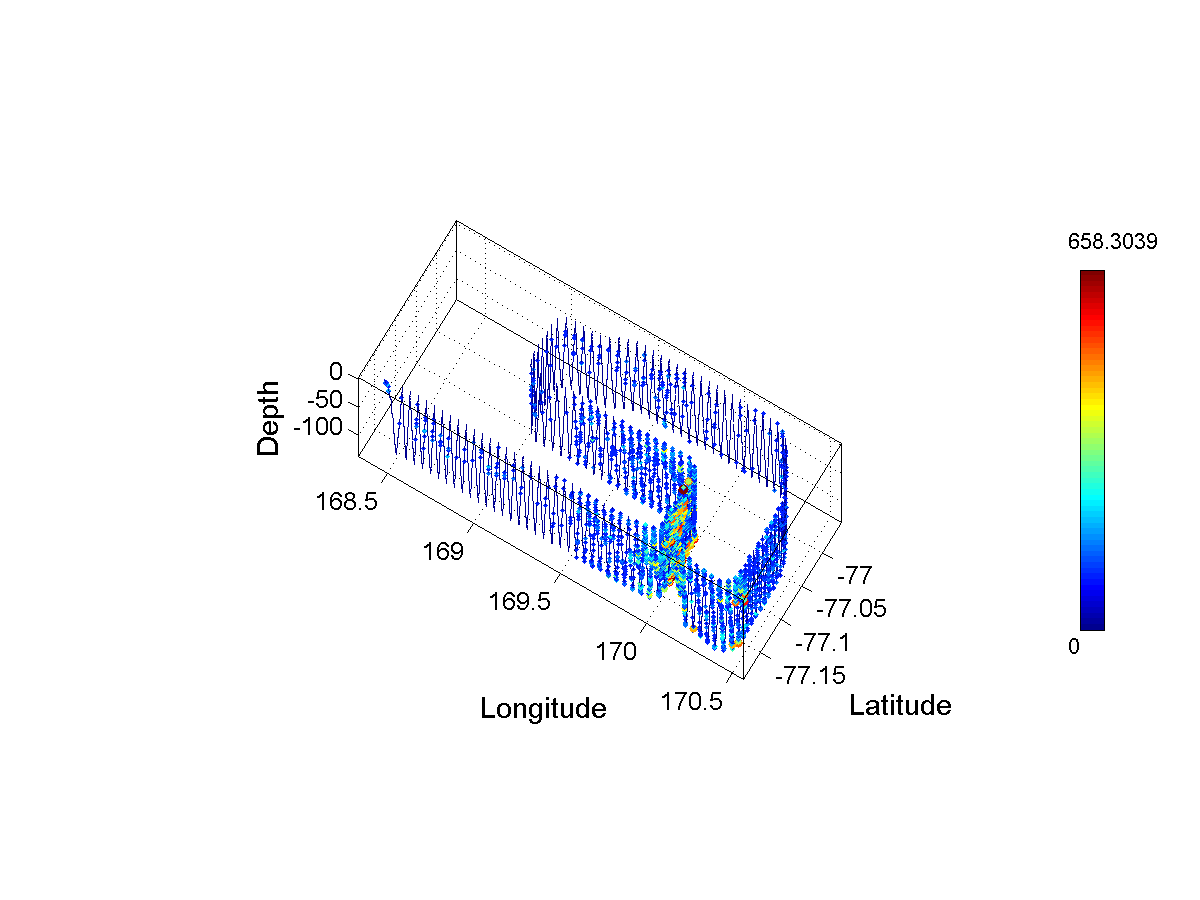
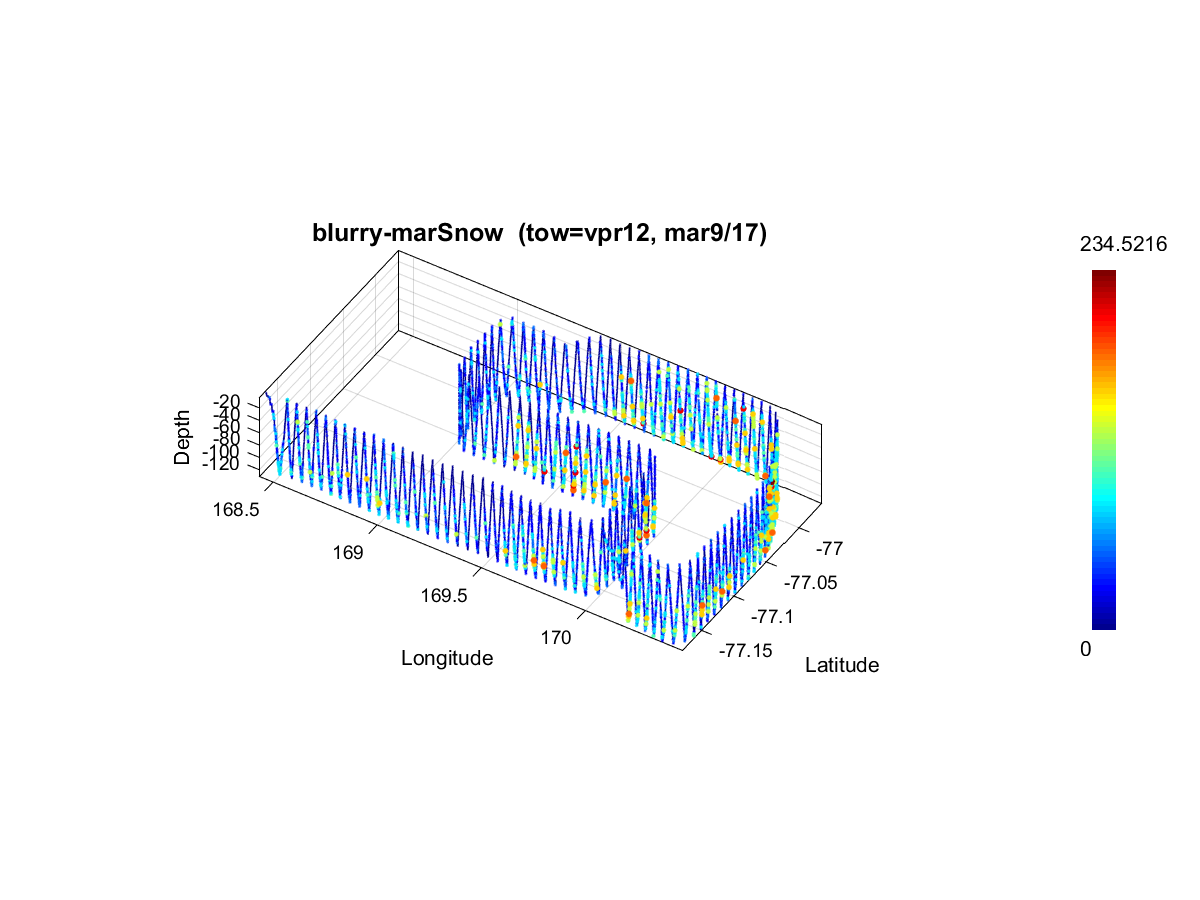
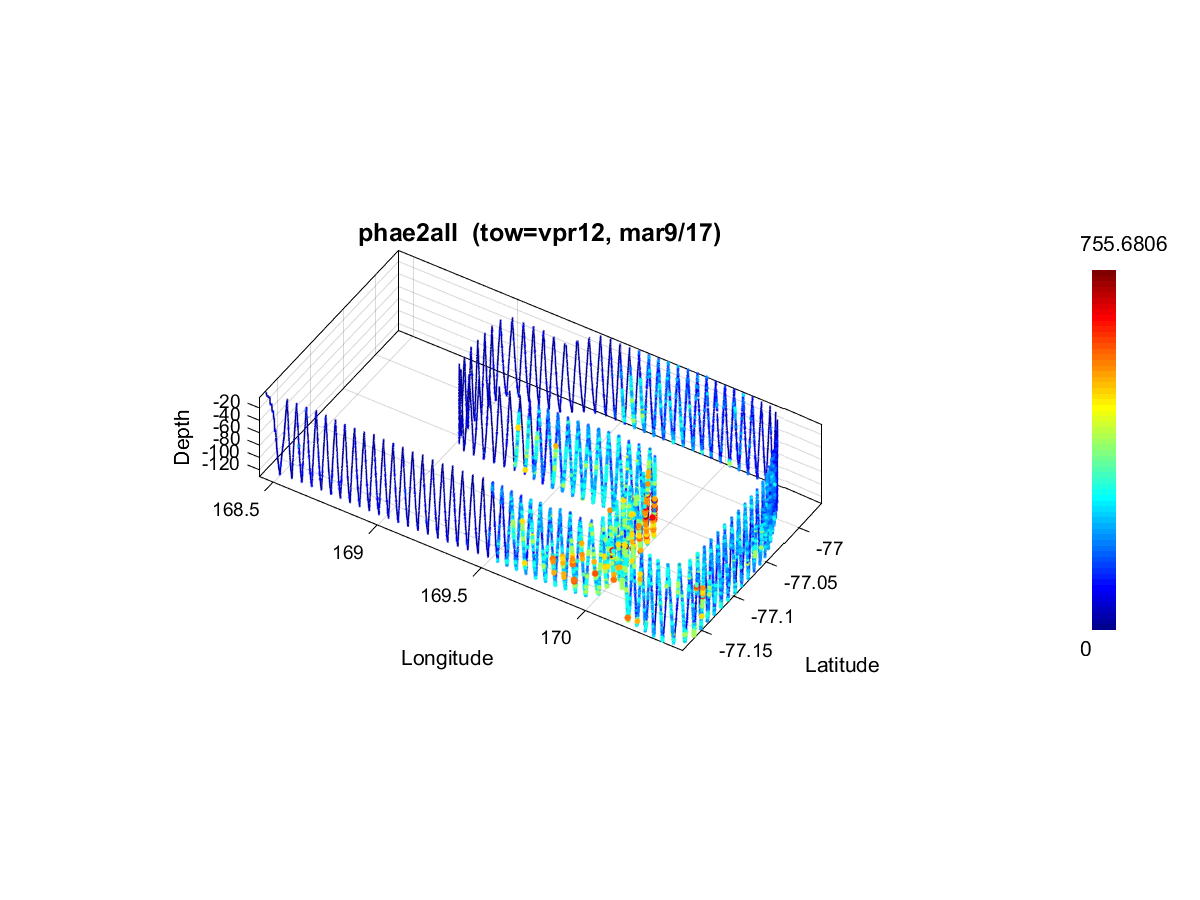
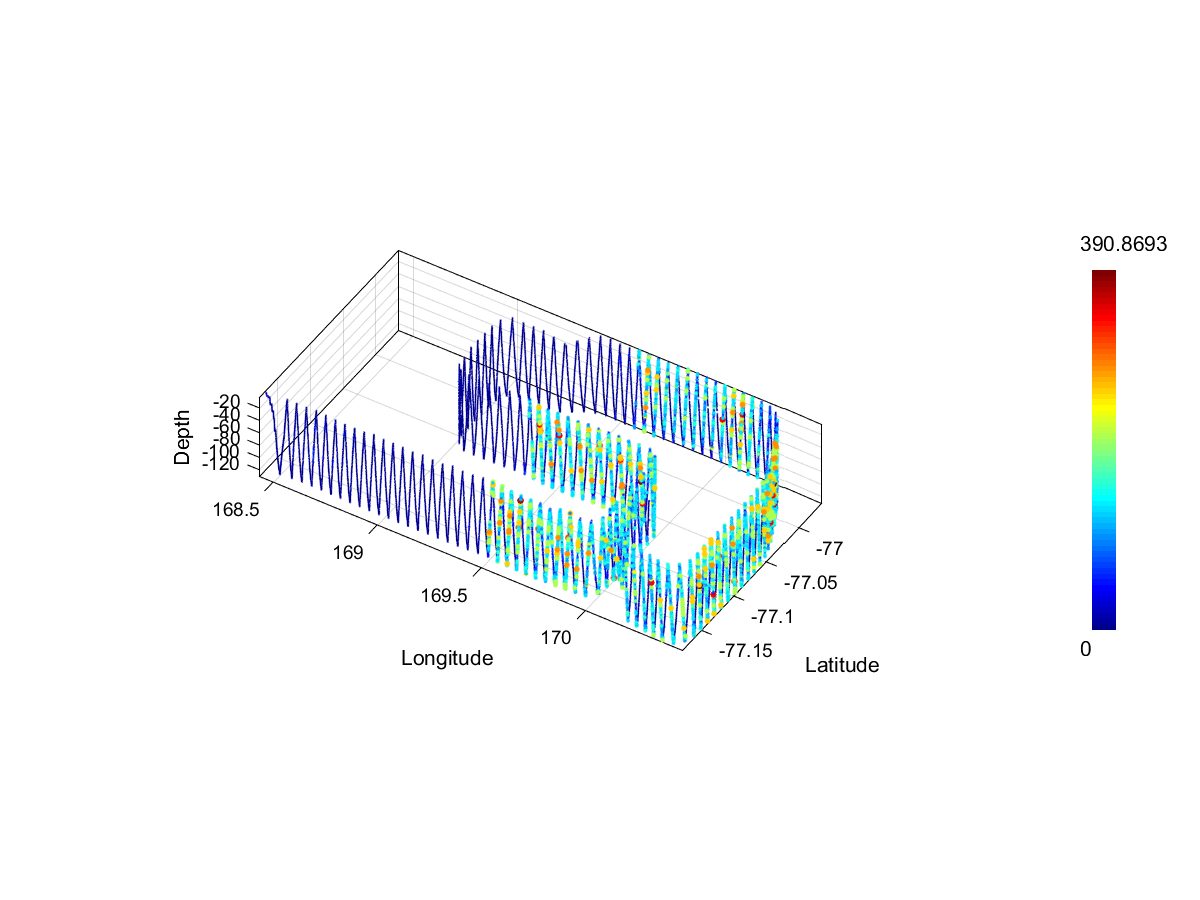
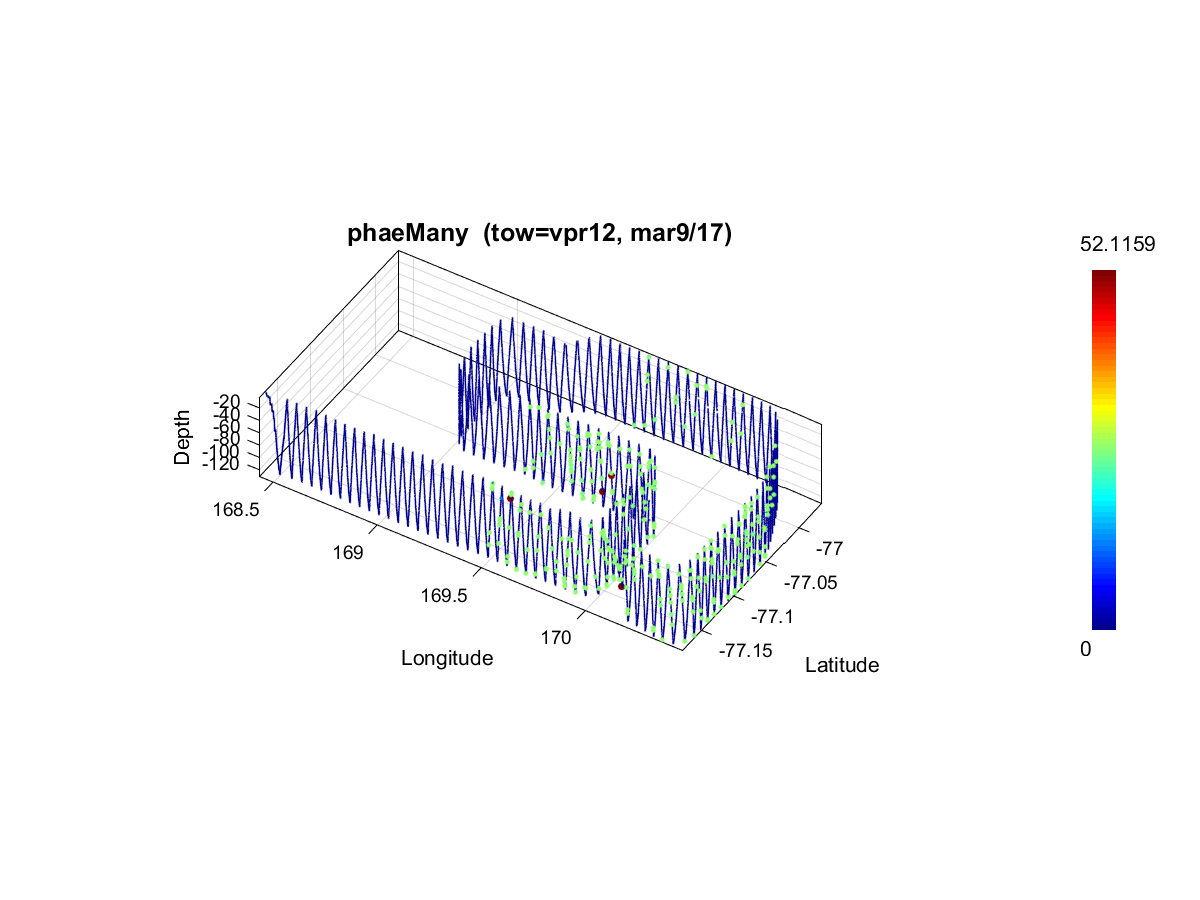
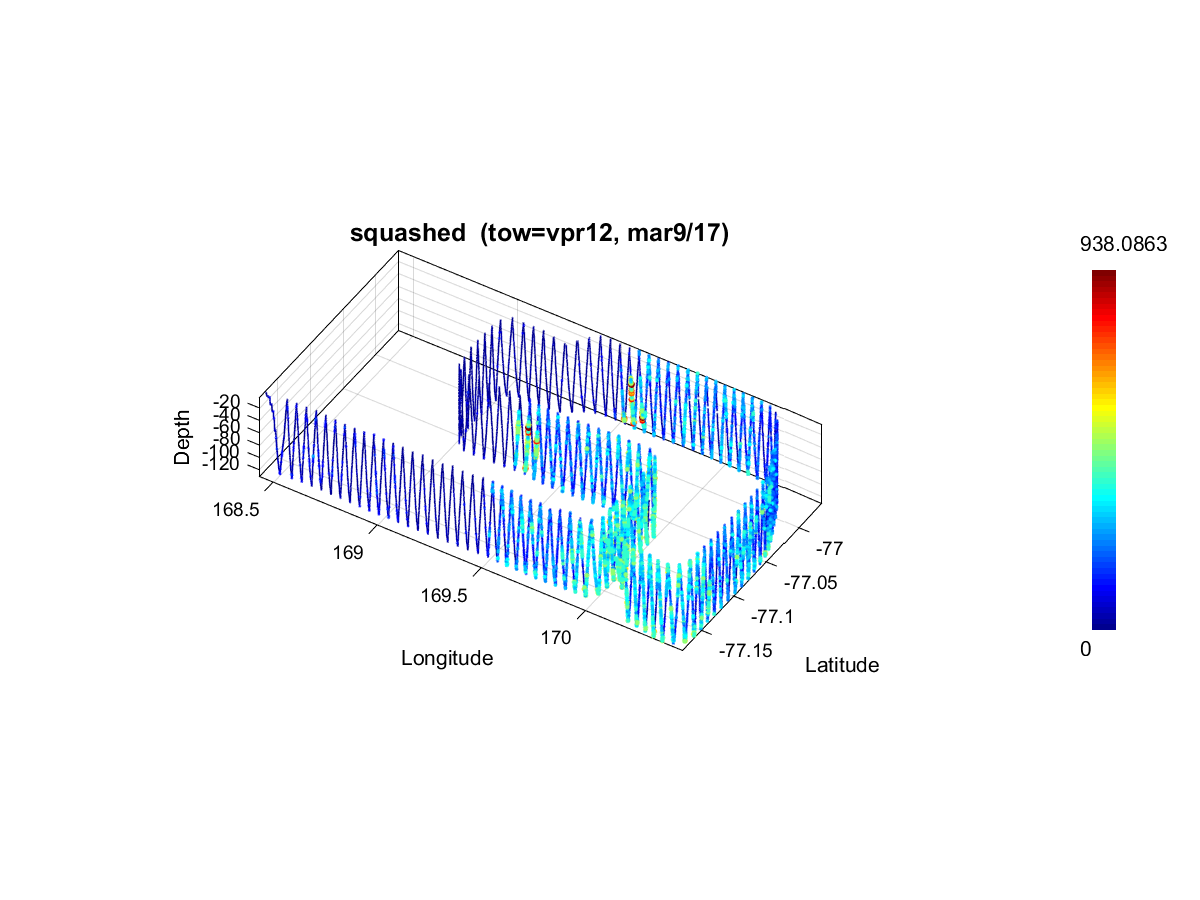
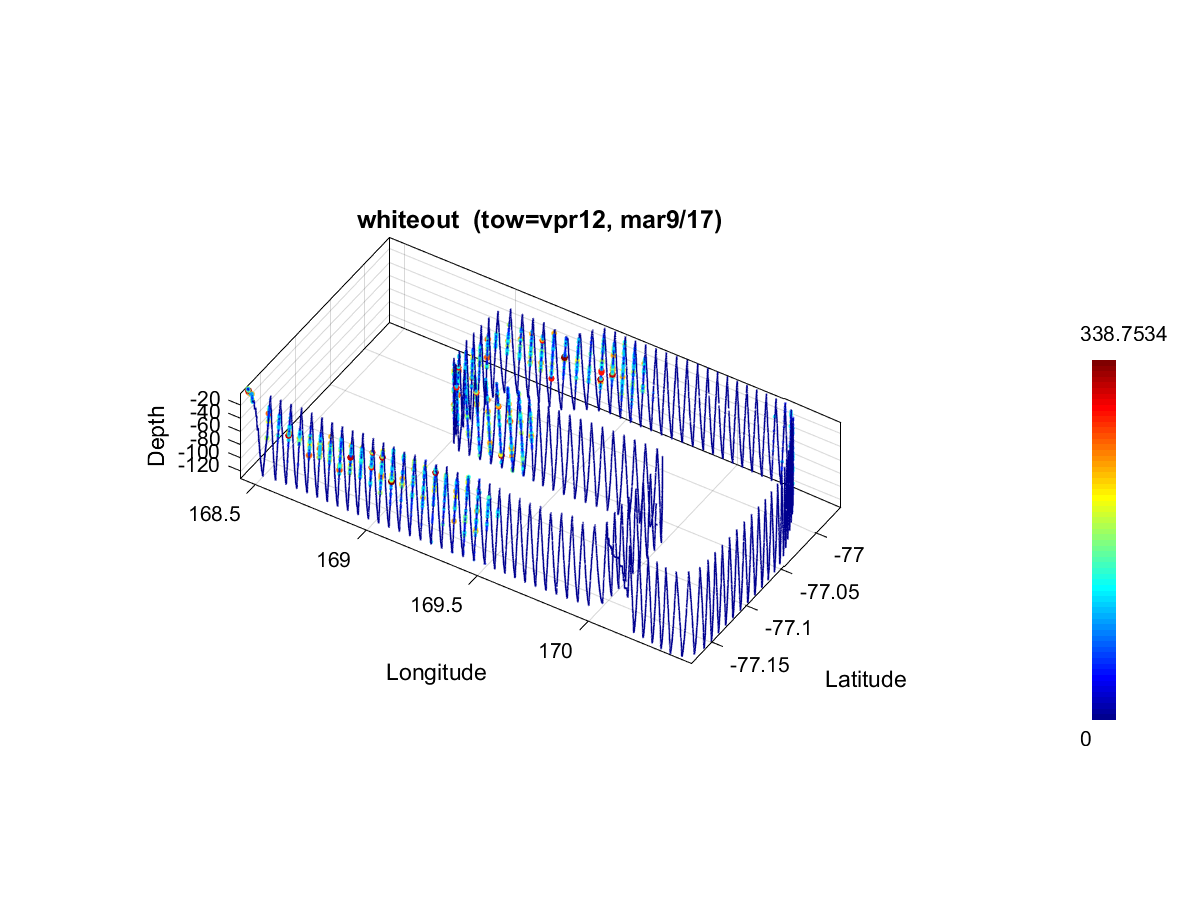
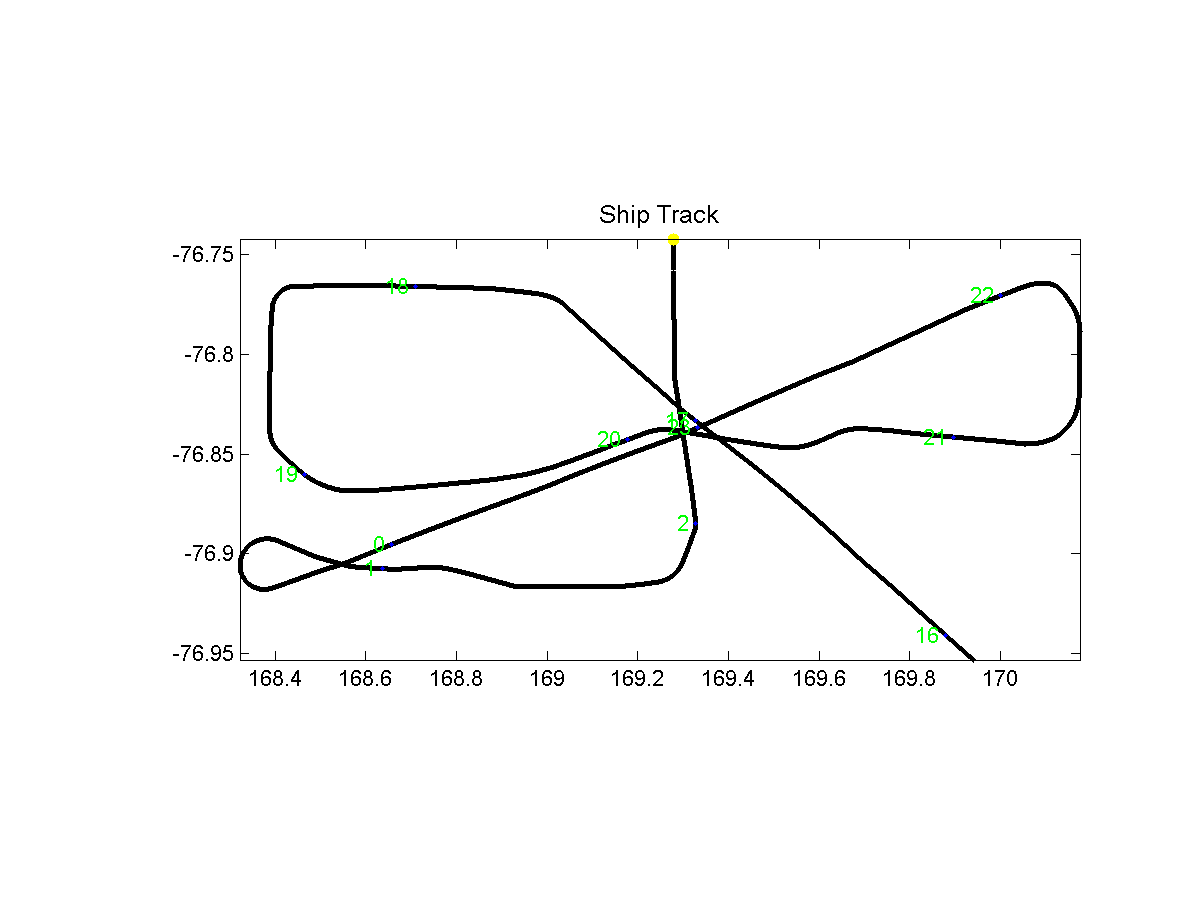
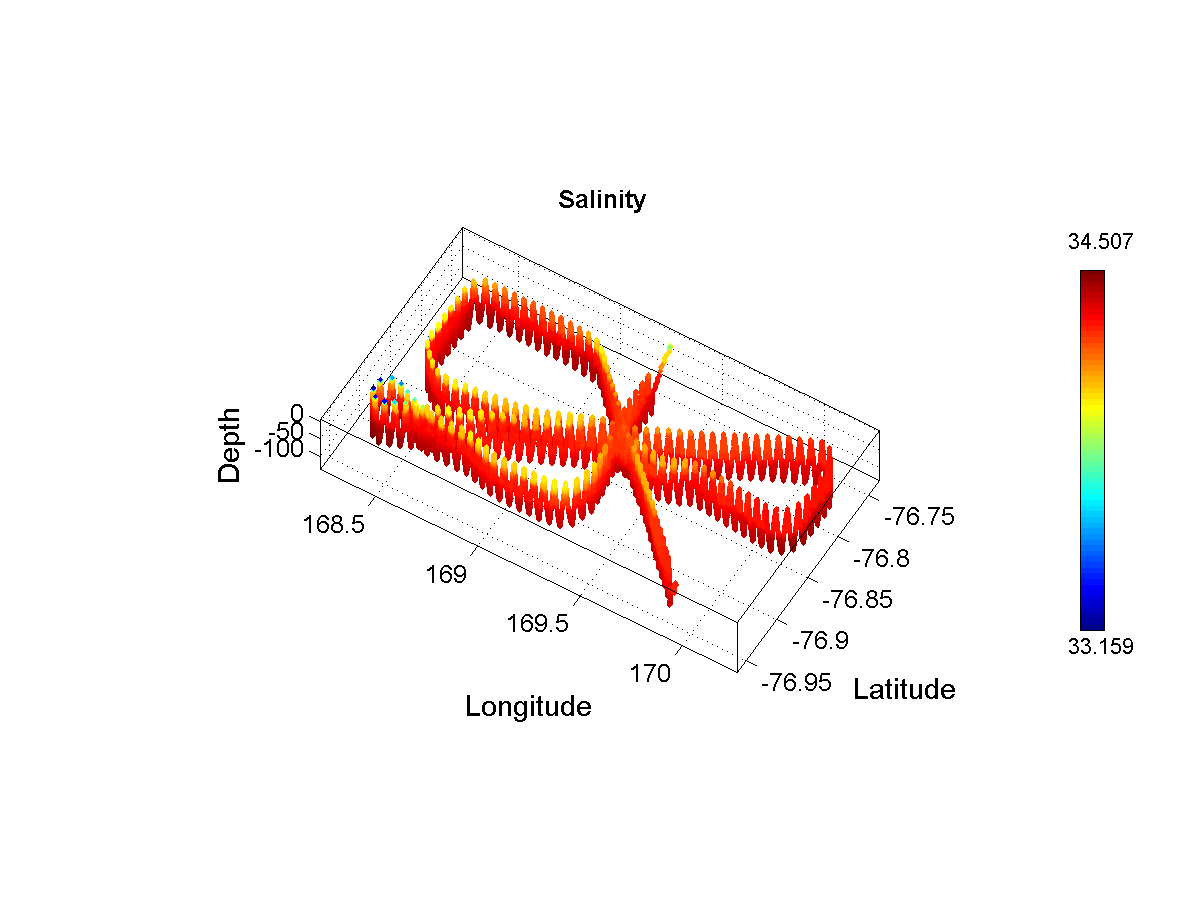
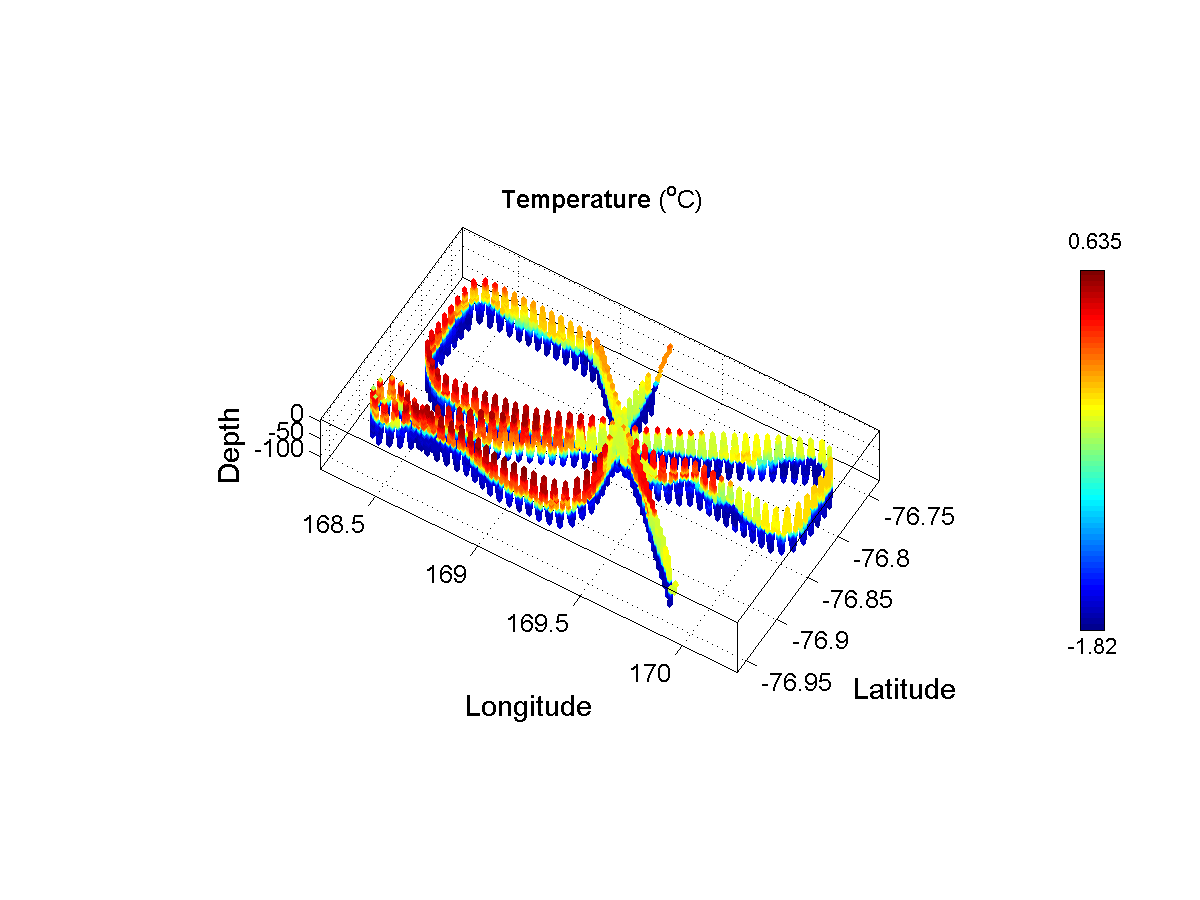
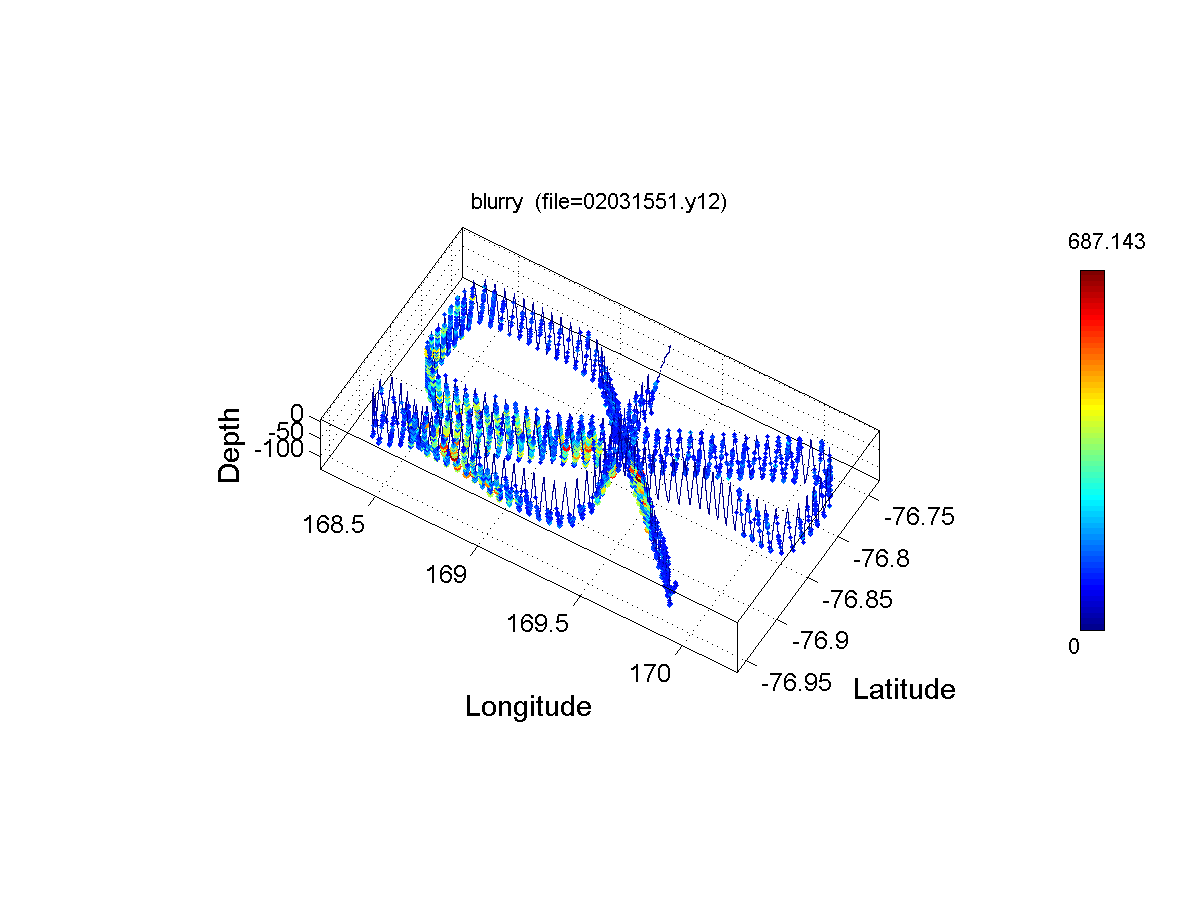
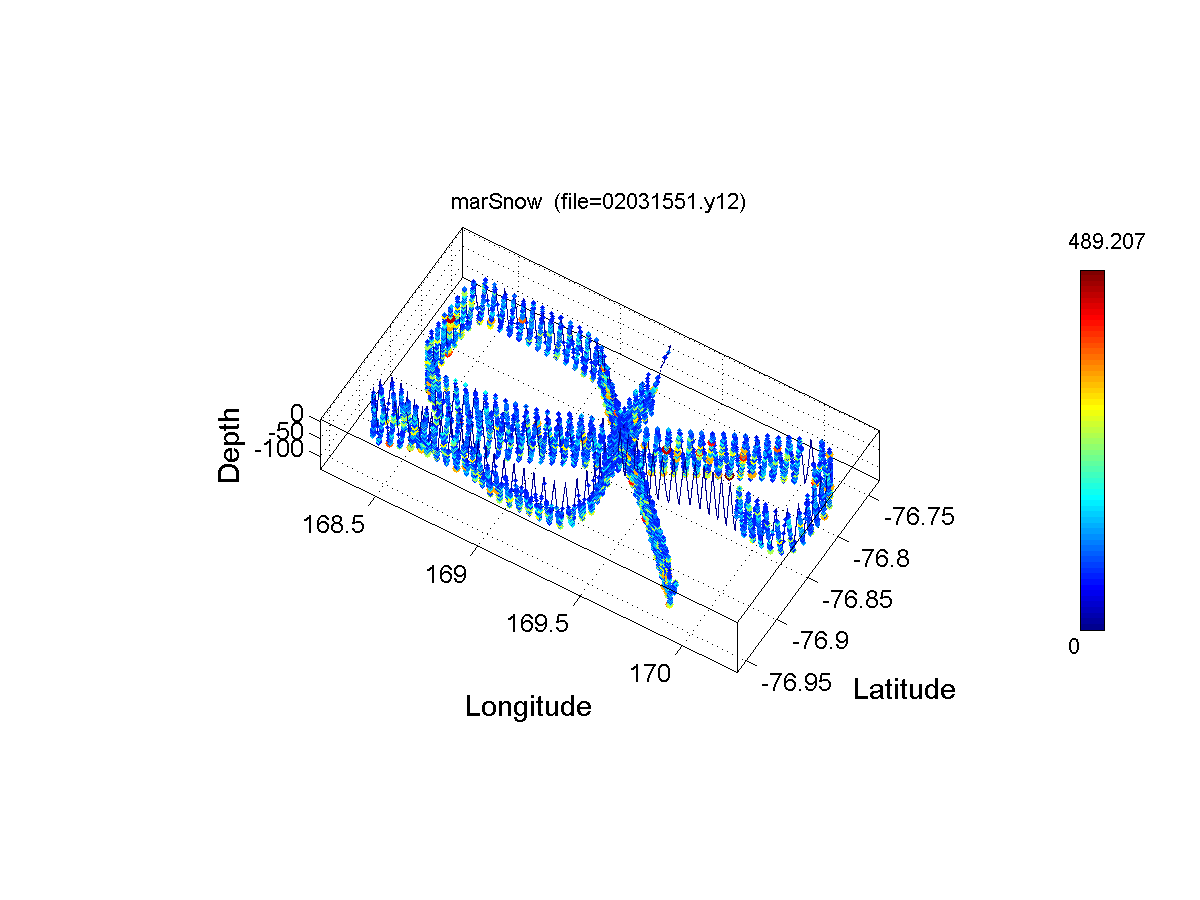
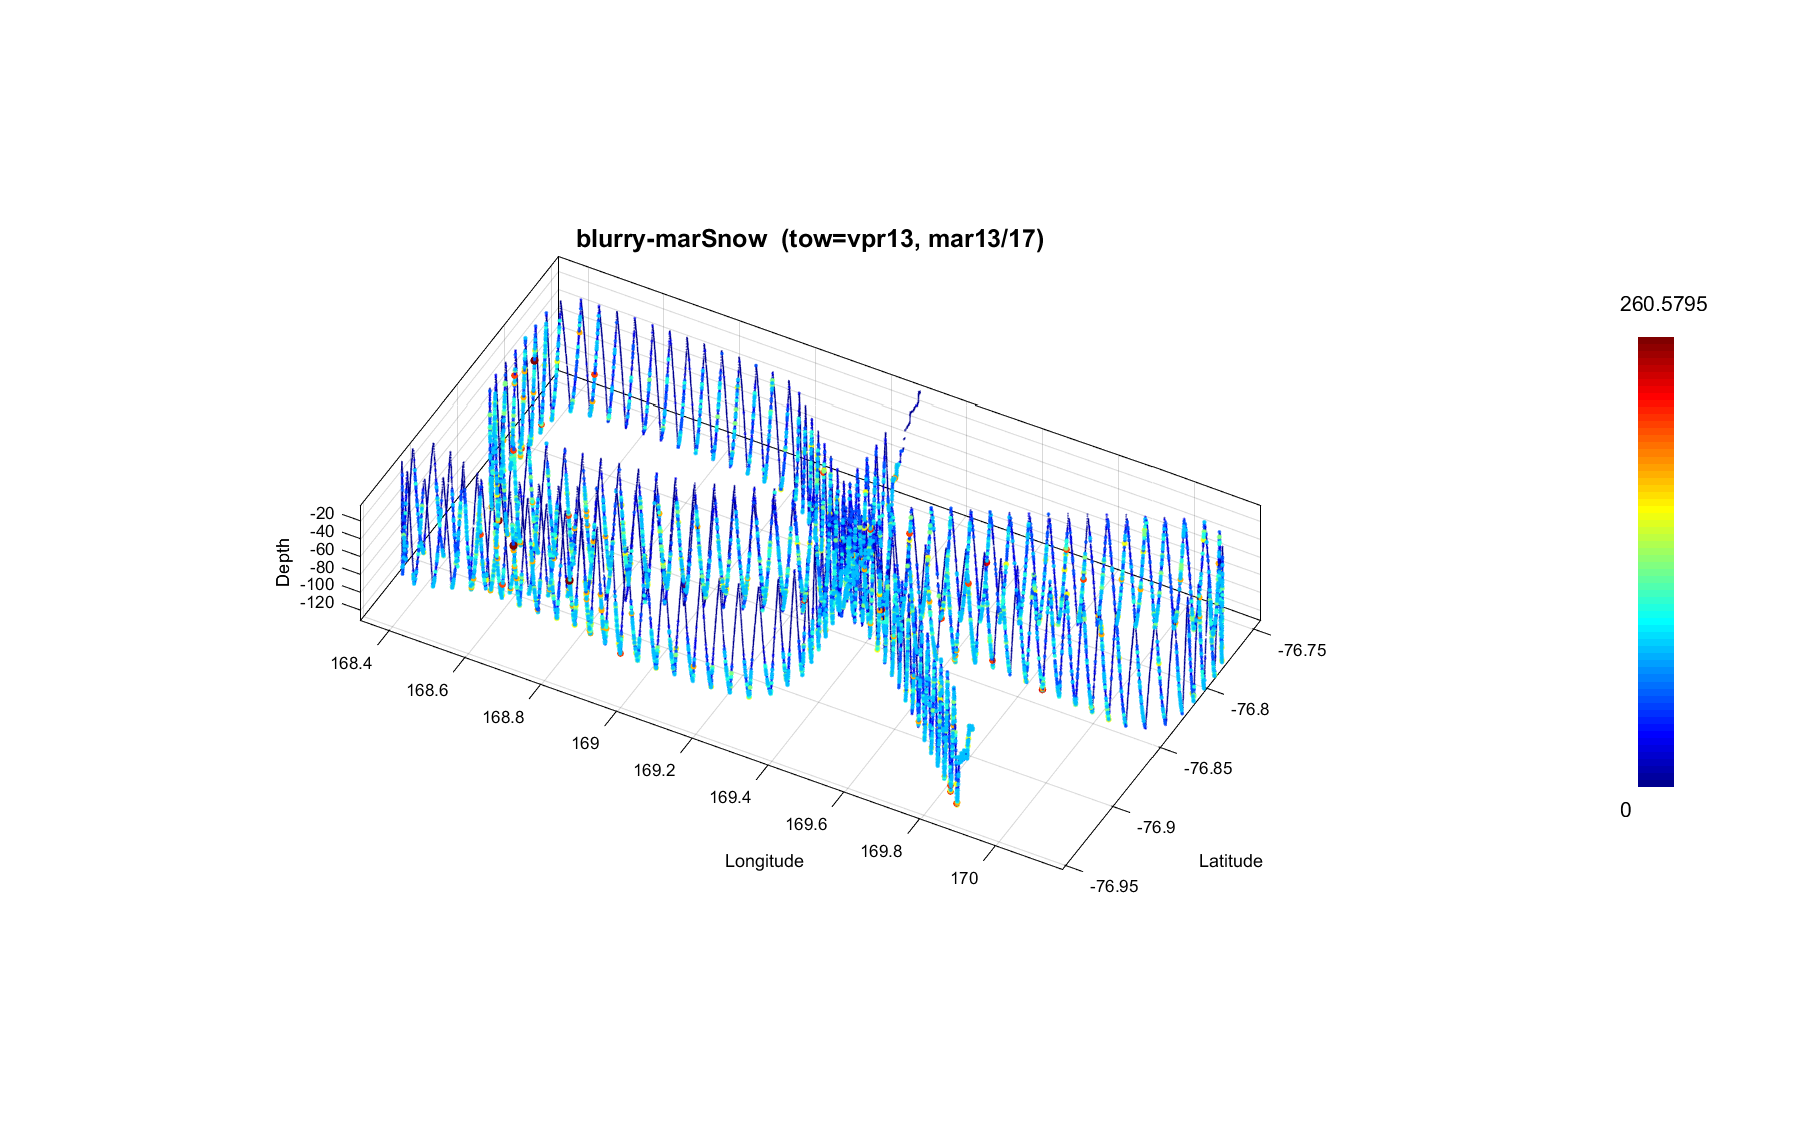
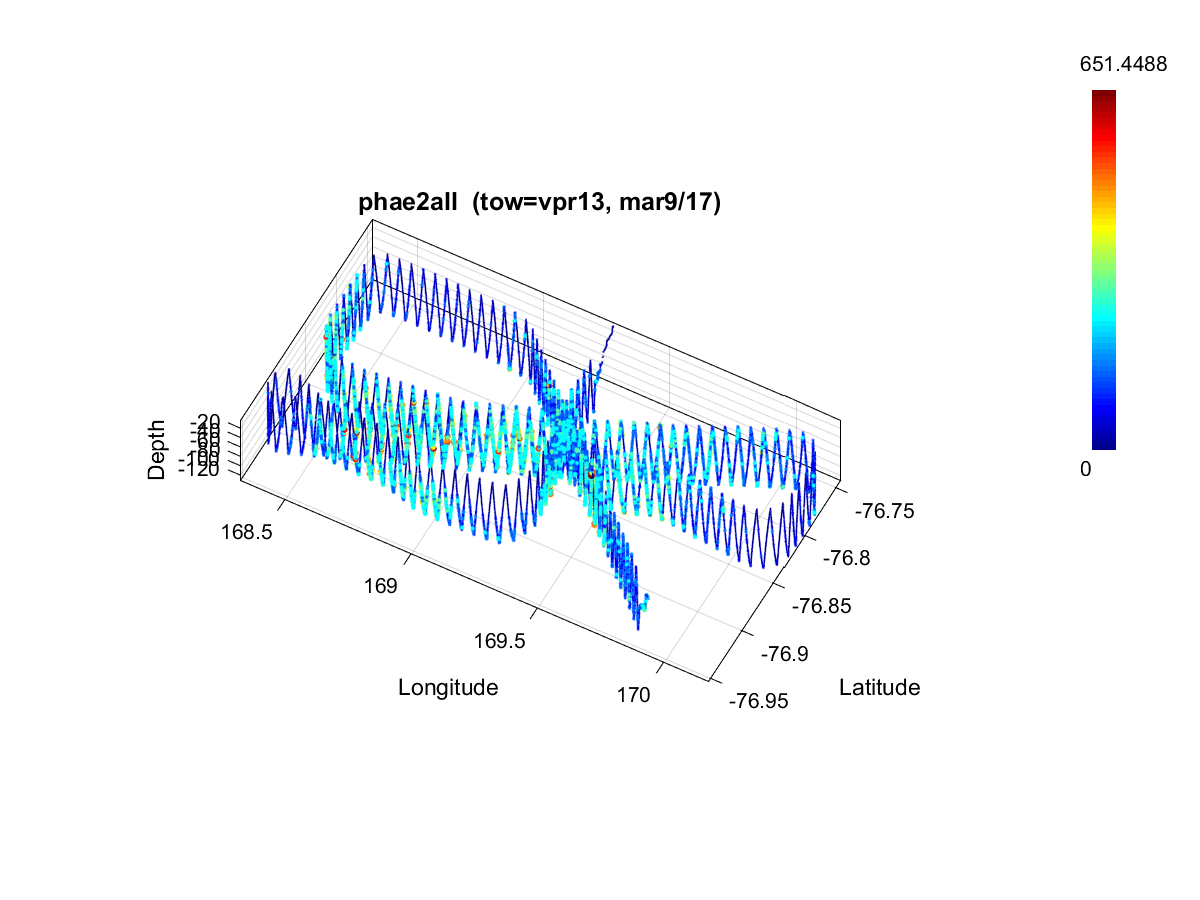
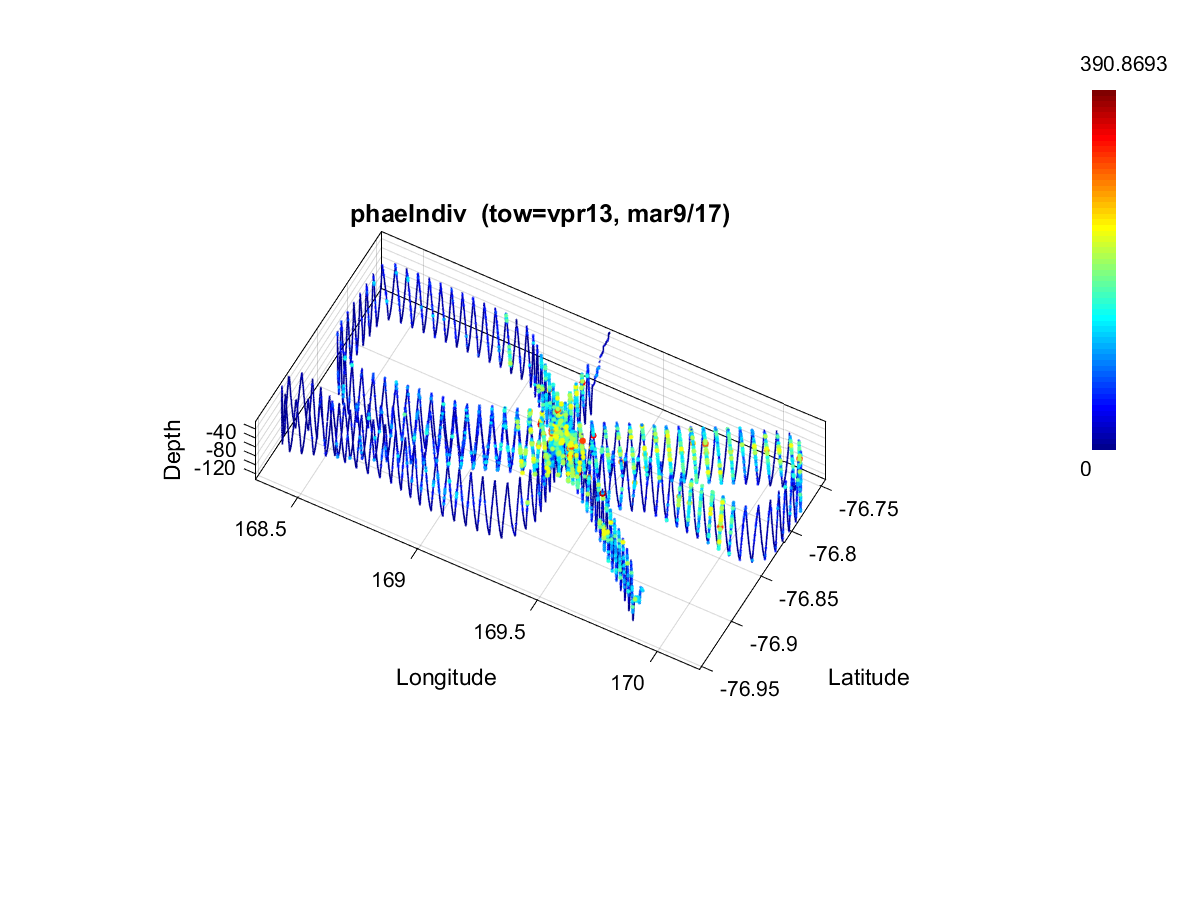
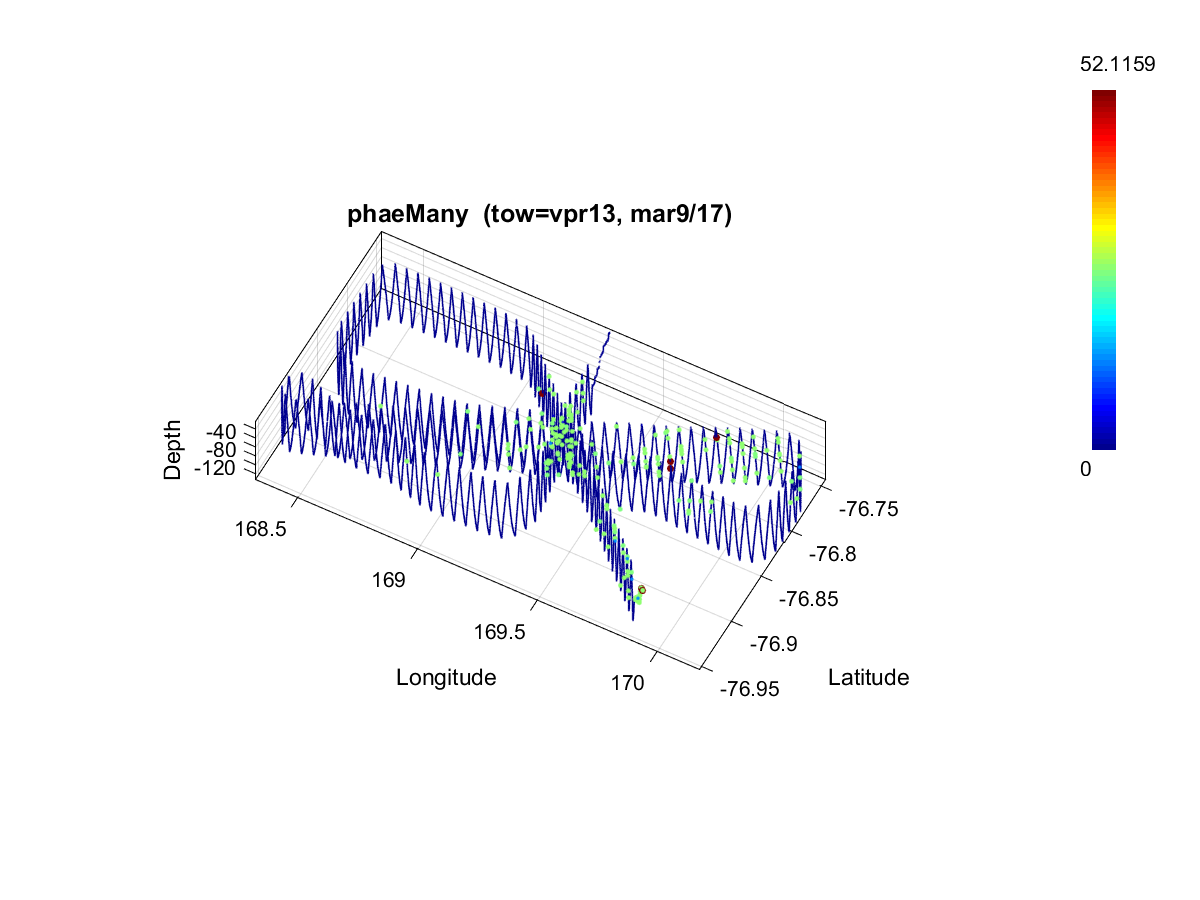
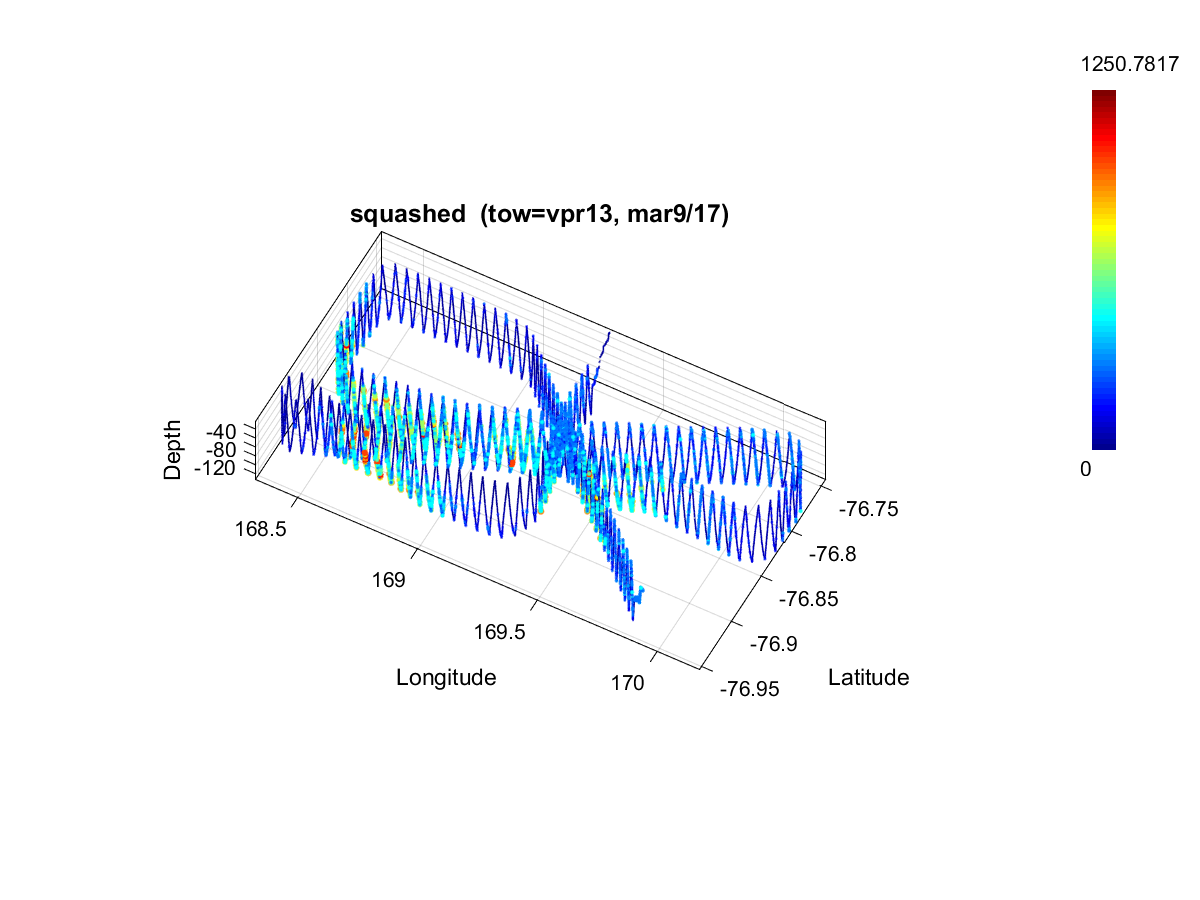
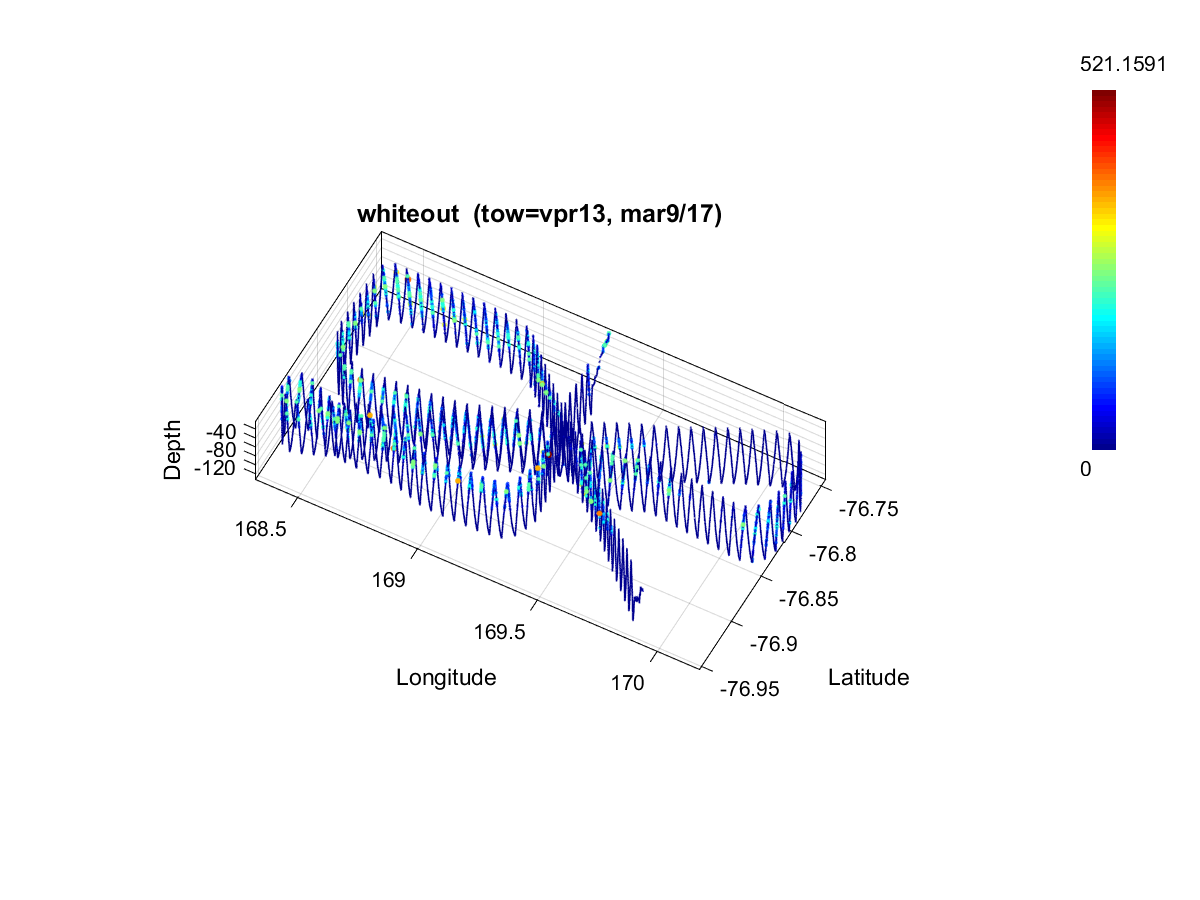
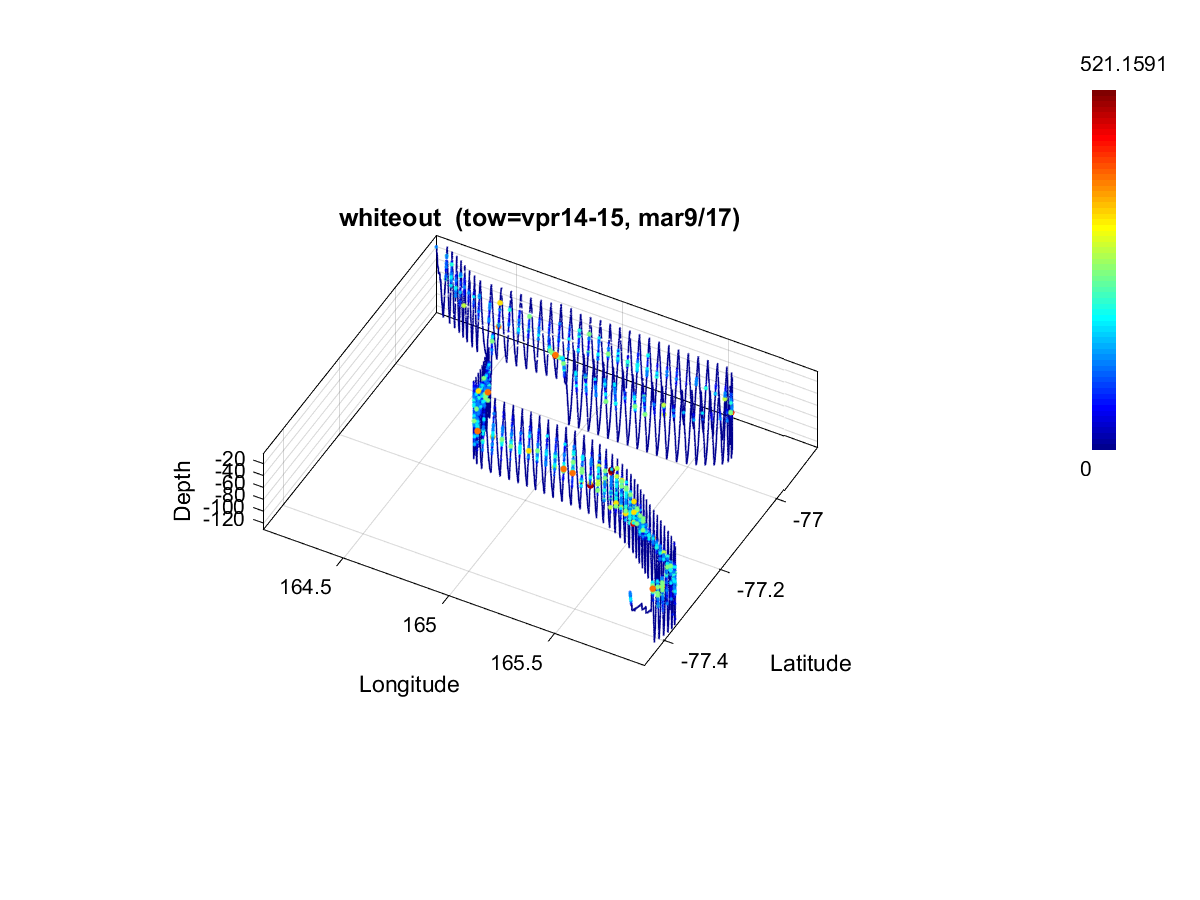
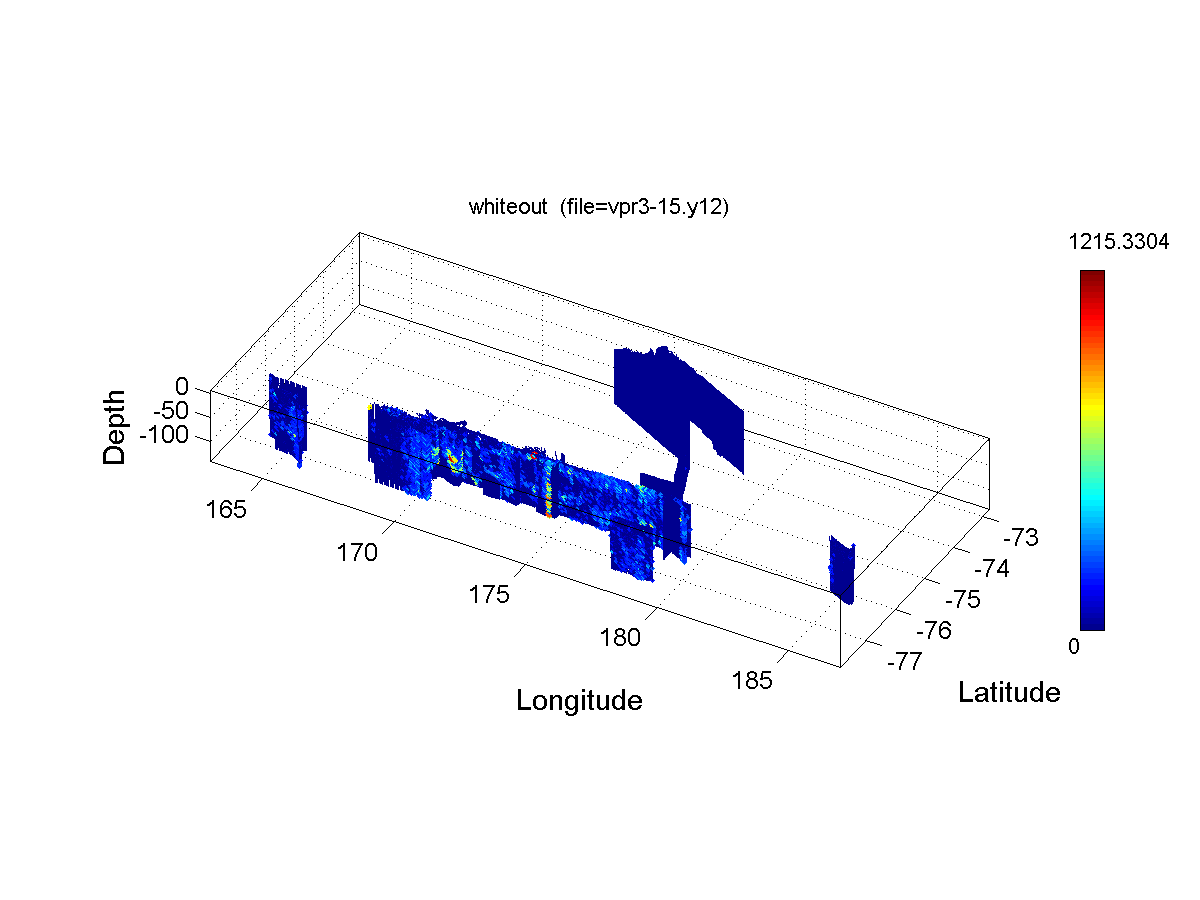
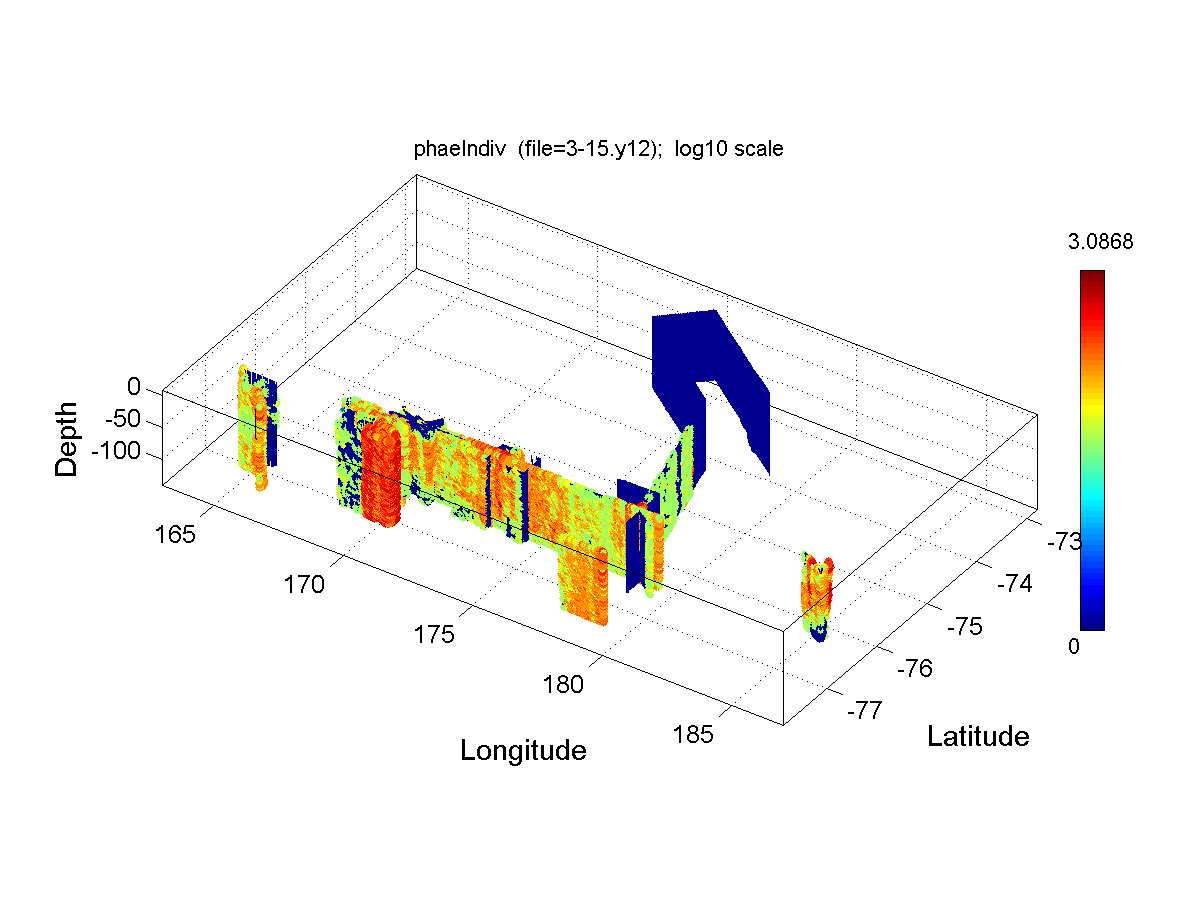
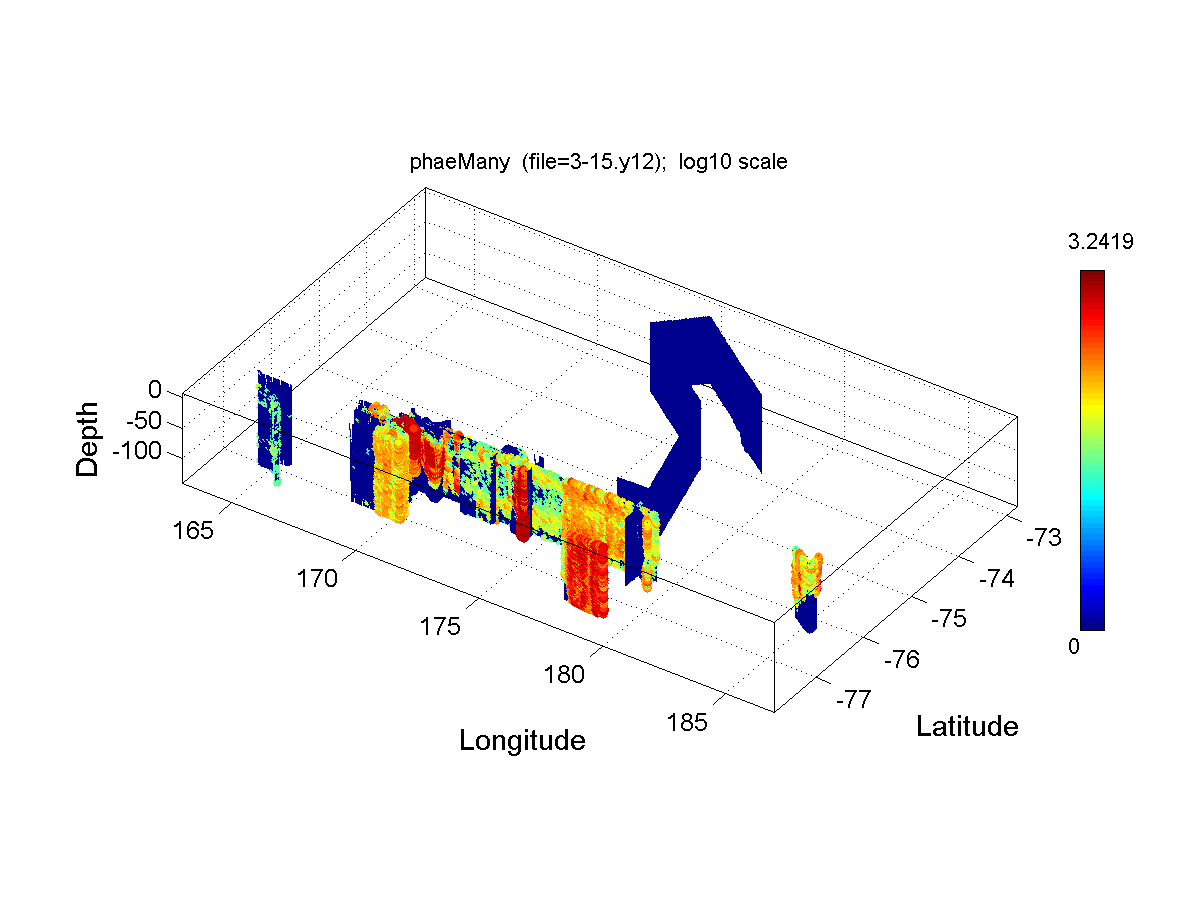
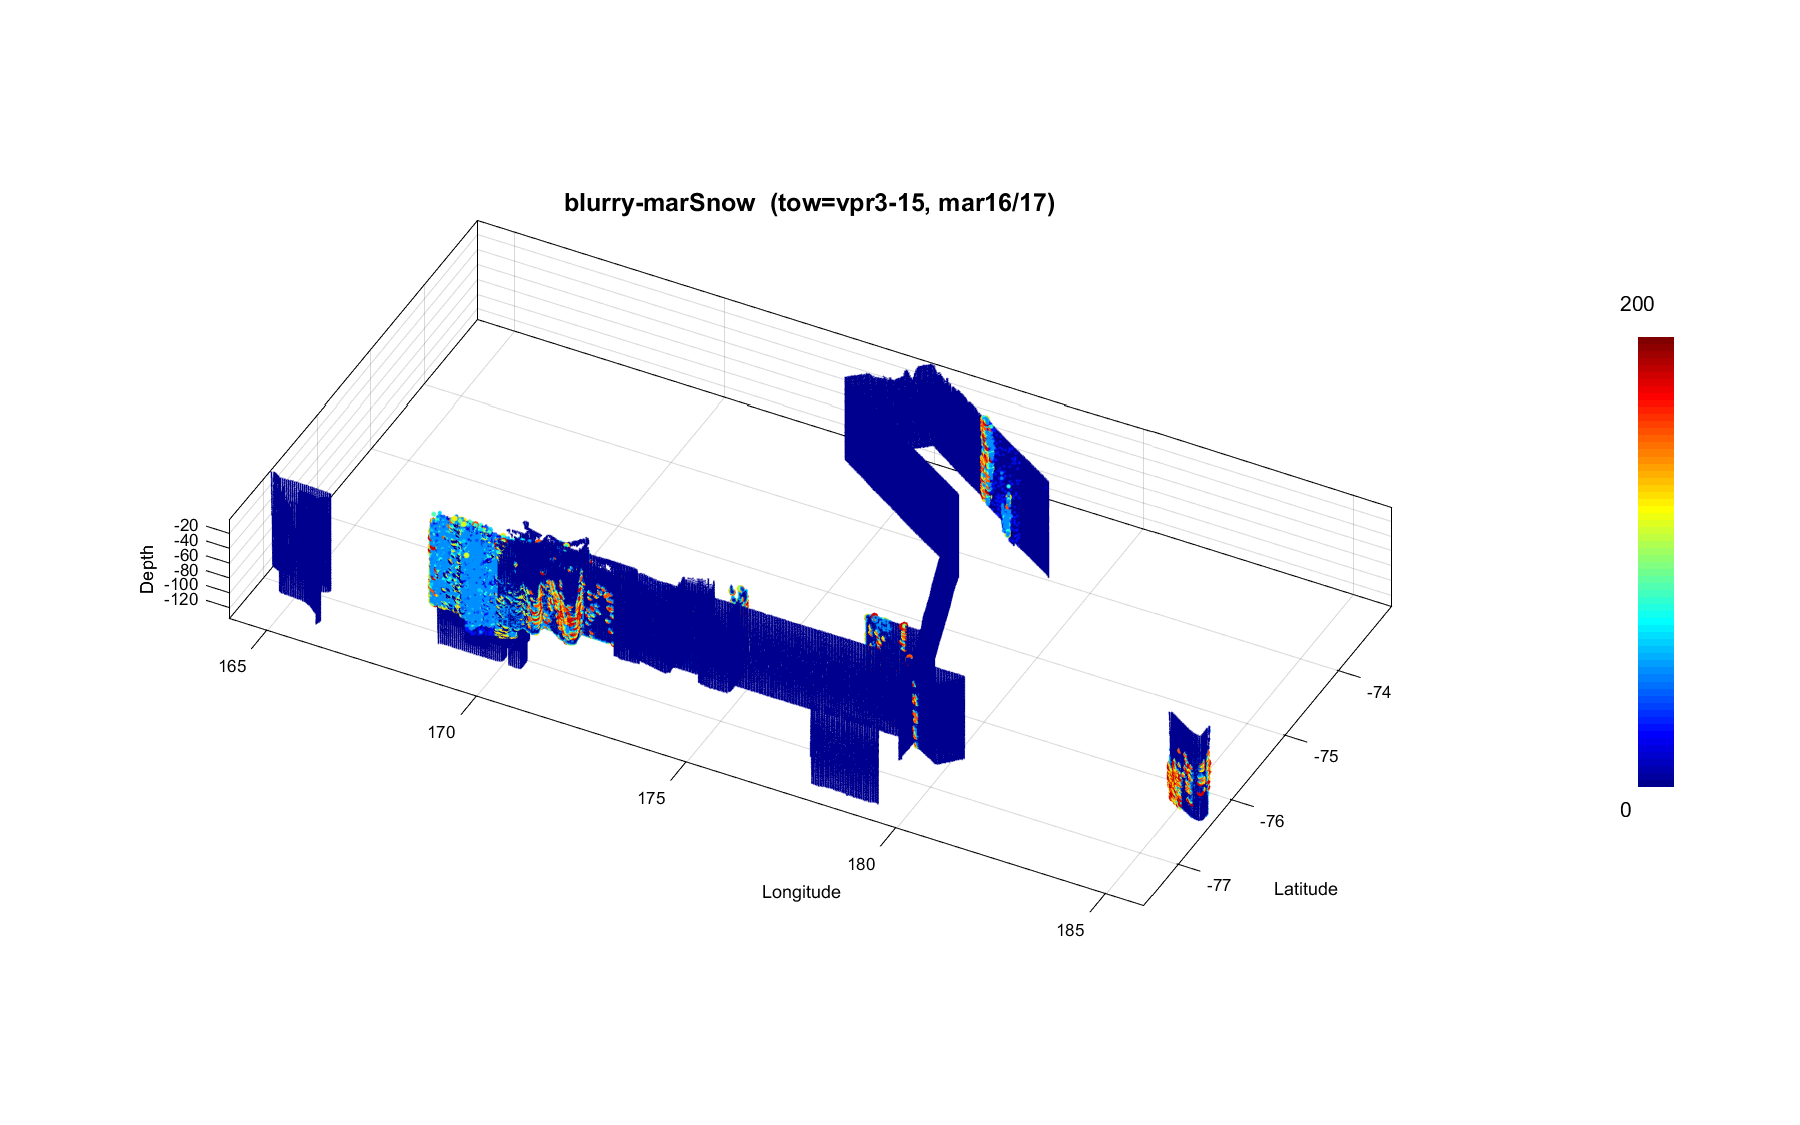
VPR1     In transit; recovered early
Jan 1-3        VPR2     In transit; diatom aggregates?
Jan 10         VPR3     Eddy 2 radial section
Jan 14-15    VPR4     Eddy 3 survey
Jan 16         VPR5     Frontal region between high and low biomass areas; no O2 data
Jan 16-17    VPR6     Survey of low biomass area
Jan 18          VPR7     Re-survey of Eddy 3 core; includes intercalibration section with MVP
Jan 19-20     VPR8     Survey to and around Ross Bank
Jan 25          VPR9     Ross Ice Shelf eddy survey
Jan 27-28     VPR10    Ross Bank to Joides Trough; Phaeocystis to the SE, small bead-like
                                   diatom chains to the NW
Feb 1           VPR11    Survey of Ice Edge Eddy; lots of Phaeocystis with kidney beans in the
                                    middle.
Feb 3           VPR12    Frontal region: diatoms on top of Phaeocystis to the west, 100m layer
                                    of all Phaeocystis to the east.
Feb 4          VPR13    Survey of Ice Edge Eddy
Feb 5-6       VPR14/15 Western Ross Sea to McMurdo Sound

                                              Each VPR tow is presented above as a set of 3D plots. To get more freedom when analyzing these plots, a corresponding set of MATLAB's
                                              figures is presented in a Table below. After downloading and opening Fig file in MATLAB, one can rotate this plot, zoom it in and out, change
                                              size etc. for better viewing.

                                  Table 3. VPR tows from cruise NBP1201. Physical parameters and taxon groups (matlab figs).
   Date/vpr tow
 vpr track/taxon 1
 Fluor/taxon 2
 OBS/taxon 3
 Par/taxon 4
 Rho/taxon 5
 Sal/taxon 6
   Temp
   24-Dec-2011
  12242259.y11
         track        Fluor         Obs         Par        Rho     Salinity   Temperature
         --------
         --------  no taxon data
         --------          --------          --------

   25-Dec-2011
  12250104.y11
         track        Fluor         Obs         Par        Rho     Salinity   Temperature
       --------          --------  no taxon data          --------          --------          --------

   01-Jan-2012
  01011850.y12
         track        Fluor         Obs         Par        Rho     Salinity   Temperature
        'blurry'     'marSnow'      'phaeIndiv'     'phaeMany'     'squashed'    'whiteout'    VPR1

   02-Jan-2012
  01020536.y12
         track        Fluor         Obs         Par        Rho     Salinity   Temperature
        'blurry'     'marSnow'      'phaeIndiv'     'phaeMany'     'squashed'    'whiteout'    VPR2

   03-Jan-2012
  01030717.y12
         track        Fluor         Obs         Par        Rho     Salinity   Temperature
        'blurry'     'marSnow'      'phaeIndiv'     'phaeMany'     'squashed'    'whiteout'    VPR2

   10-Jan-2012
  01101158.y12
         track        Fluor         Obs         Par        Rho     Salinity   Temperature
        'blurry'     'marSnow'      'phaeIndiv'     'phaeMany'     'squashed'    'whiteout'    VPR3

    14-Jan-2013
     vpr4.y12
         track        Fluor         Obs         Par        Rho     Salinity  Temperature
        'blurry'     'marSnow'      'phaeIndiv'     'phaeMany'     'squashed'    'whiteout'    VPR4
 Taxa/TS plot (abs)^         'blurry'     'marSnow'      'phaeIndiv'     'phaeMany'     'squashed'    'whiteout'    TS plot
 Taxa/TS plot (norm)^^         'blurry'     'marSnow'      'phaeIndiv'     'phaeMany'     'squashed'    'whiteout'    TS plot

   16-Jan-2012
   01160701.y12
         track
       Fluor
         Obs
      Par
        Rho
     Salinity
   Temperature
       'blurry'
      'marSnow'
     'phaeIndiv'
  'phaeMany'
    'squashed'
   'whiteout'
     VPR5

   16-Jan-2012
   01162222.y12
         track        Fluor          Obs          Par         Rho      Salinity  Temperature
        'blurry'     'marSnow'      'phaeIndiv'   'phaeMany'     'squashed'    'whiteout'      VPR6

    18-Jan-2012
    01180038.y12
         track
       Fluor
        Obs
        Par
       Rho
    Salinity
  Temperature
        'blurry'
     'marSnow'
     'phaeIndiv'
    'phaeMany'
    'squashed'
   'whiteout'
     VPR7

    19-Jan-2013
  01191223.y12
        track
      Fluor
       Obs
       Par
      Rho
   Salinity
 Temperature
        'blurry'     'marSnow'     'phaeIndiv'     'phaeMany'    'squashed'    'whiteout'    VPR8

    25-Jan-2012
    01250411.y12
         track        Fluor         Obs         Par        Rho     Salinity   Temperature
        'blurry'      'marSnow'      'phaeIndiv'     'phaeMany'     'squashed'    'whiteout'
    VPR9
 Taxa/TS plot (abs)^         'blurry'     'marSnow'      'phaeIndiv'     'phaeMany'     'squashed'    'whiteout'    TS plot
 Taxa/TS plot (norm)^^         'blurry'     'marSnow'      'phaeIndiv'     'phaeMany'     'squashed'    'whiteout'    TS plot


    26-Jan-2012
    01262302.y12
         track        Fluor         Obs         Par        Rho     Salinity   Temperature
        'blurry'     'marSnow'      'phaeIndiv'     'phaeMany'     'squashed'    'whiteout'     VPR10

    01-Feb-2012
    02010005.y12
         track        Fluor         Obs         Par        Rho     Salinity   Temperature
        'blurry'     'marSnow'      'phaeIndiv'     'phaeMany'     'squashed'    'whiteout'    VPR11

   03-Feb-2012
   02030110.y12
         track        Fluor         Obs         Par        Rho     Salinity   Temperature
        'blurry'     'marSnow'      'phaeIndiv'     'phaeMany'     'squashed'    'whiteout'    VPR12

   03-Feb-2012
   02031551.y12
         track        Fluor         Obs         Par        Rho     Salinity   Temperature
        'blurry'     'marSnow'      'phaeIndiv'     'phaeMany'     'squashed'    'whiteout'    VPR13

   05-Feb-2012
  02050247.y12
         track        Fluor         Obs         Par        Rho     Salinity   Temperature
        'blurry'     'marSnow'      'phaeIndiv'     'phaeMany'     'squashed'    'whiteout'    VPR14

   05-Feb-2012
   02050826.y12
         track        Fluor         Obs         Par        Rho     Salinity   Temperature
        'blurry'     'marSnow'      'phaeIndiv'     'phaeMany'     'squashed'    'whiteout'    VPR14_15
    Composite
   Jan 3 -- Feb 5  2012
       track        Fluor
         Obs
         Par
         Rho
      Salinity
  Temperature
      'blurry'     'marSnow'      'phaeIndiv'    'phaeMany'     'squashed'      'whiteout'     VPR 3_15
        log10 scale


    'phaeIndiv_log'    'phaeMany_log'


                                                        Note: ^ absolute frequency of TS pairs
                                                                ^^ frequency normalized by total number of TS pairs

                           Satellite data (Chl-a and SST)

                                              Satellite color imagery from MODIS-A was used to create maps of Chl-a and SST distributions in the Ross Sea area [160 E -- 155 W, -78.5 S -- -76.5 S].
                                              We began with browsing Level 1 and 2 archive data http://oceancolor.gsfc.nasa.gov/cgi/browse.pl?sen=am by manually choosing and downloading
                                              scenes where at least 30% of the total area was cloud free. Then downloaded L1A files were processed to Level 2 with spatial resolution 500 m using
                                              SEADAS version 6.4 . After that all available scenes were mapped  and labeled to get Chl-a  and SST distributions, currently, from December 2003
                                              to December 2013. To browse the scenes, they are represented in form of animation:    prism_comb.fli . The total number of scenes are used is 533.