 |
August 25 - September 9, 2003 |
|
August 25 - September 9, 2003 |
|
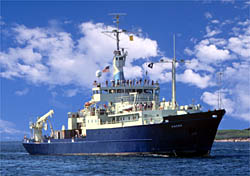
Cruise kn172-17 was a transatlantic research expedition from Malta to Woods Hole on R/V Knorr led by Chief Scientist Dr. Cabell Davis. A real-time satellite support to expedition in order to route the ship through several different eddy features on her way across the Atlantic. It is hypothesized that eddy-induced disturbances play an important role not only in the pelagic food web, but also in the ocean carbon cycle. The transatlantic VPR voyage was the first of its kind to document such phenomena on a basin-wide scale. |
|
DATA
ADCP |
| Altimetry
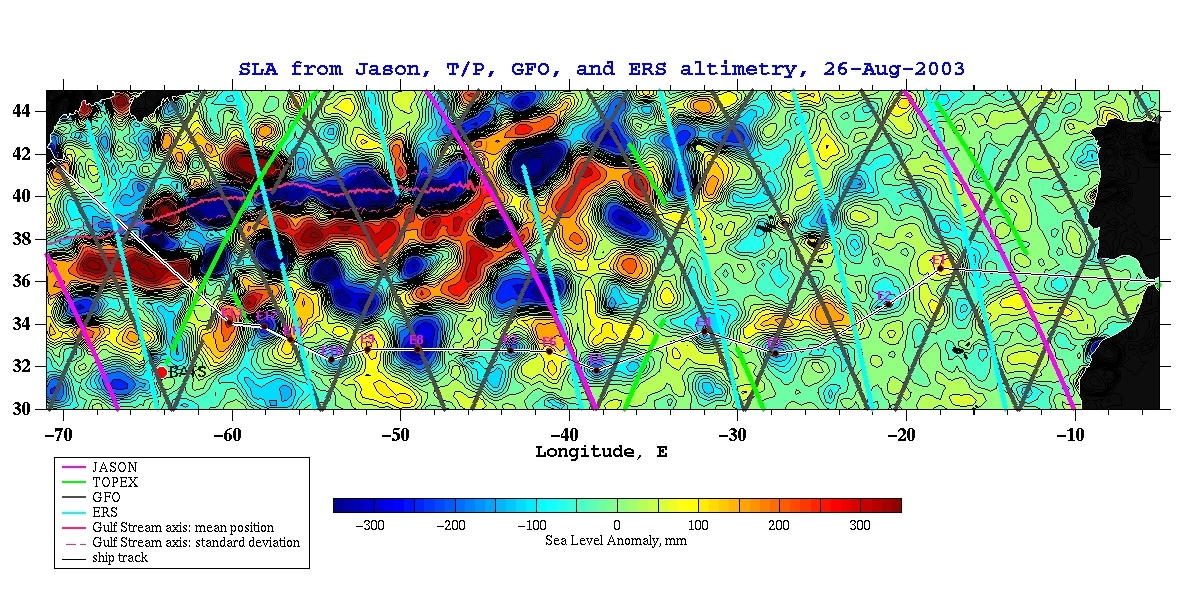
Real-time altimetric support was used to route R/V Knorr through different eddy features on her way across the Atlantic during a time period from August 25 to September 8, 2003. The CCAR web server http://ccar.colorado.edu/~realtime/welcome/ provides near real-time data streams from Jason, Topex-2, GFO, and ERS-2 altimeters. Sea Level Anomaly (SLA) data from the CCAR server were objectively analyzed prior to and during the cruise in order to choose appropriate eddy features and navigate ship's track across them. Thirteen eddy features were identified, labeled
E1 to E13 in the map for August 26, 2003 below (click to enlarge image).
E2-E5, E7-E8, E10, and E12 are negative sea level anomalies with amplitude
of sea level depression 100-150 mm east of 40W, and 200-300 mm (and more)
west of 40W. E1, E6, E9, E11, and E13 are positive sea level anomalies
with amplitude of sea level elevation approximately 150-300 mm.
|
|
back to top |
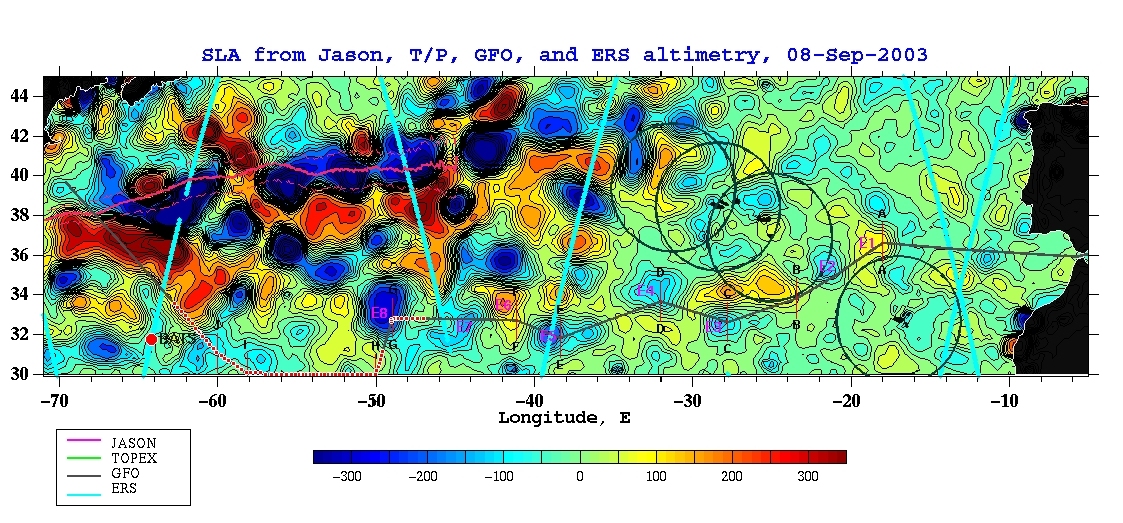
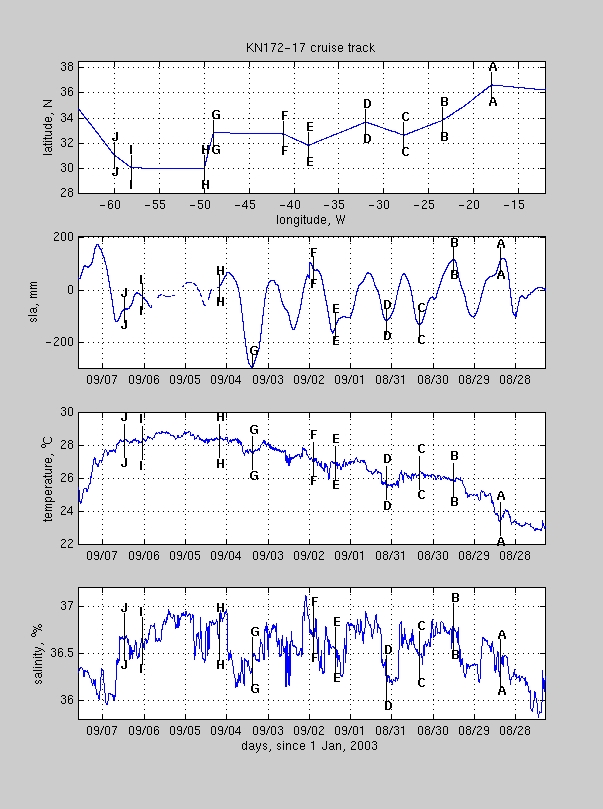
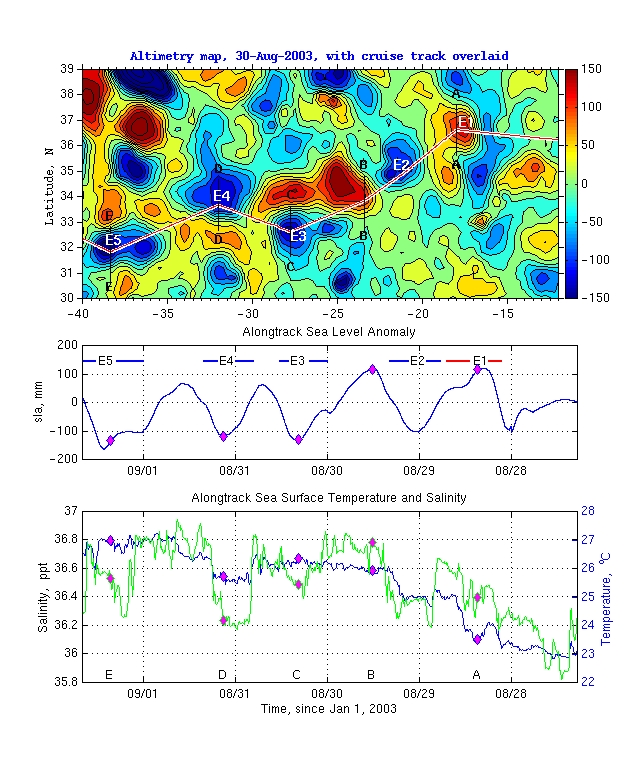
| On her way across the Atlantic R/V Knorr
crossed 8 eddies: E1-E8 from that 13 that were identified prior to the
cruise. Below is a short description of the eddies and alongtrack temperature
and salinity from the altimetry maps and underway measurements.
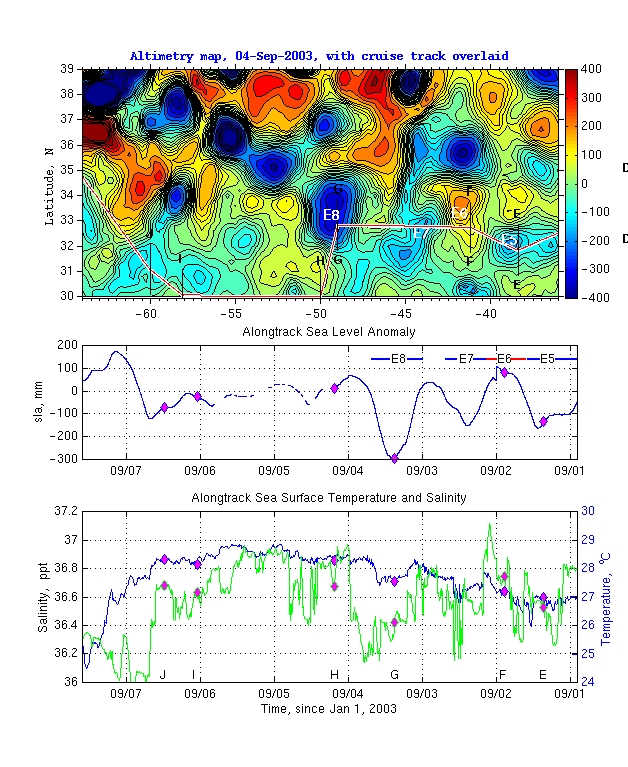
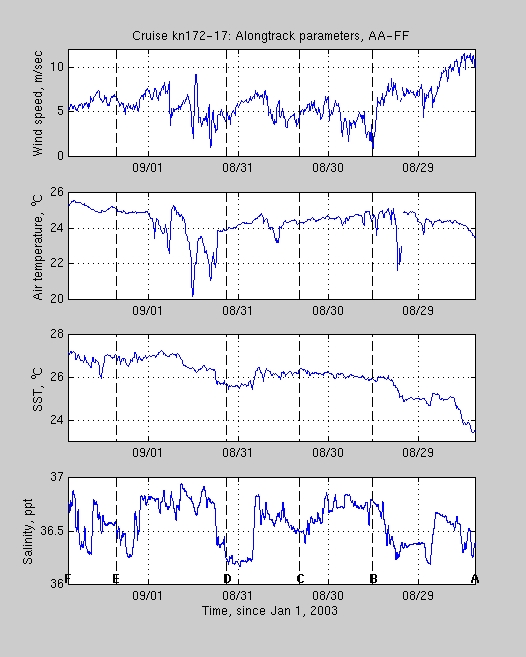
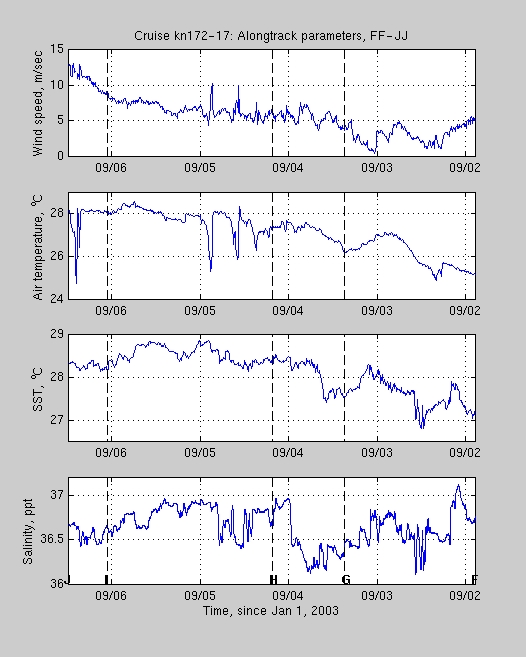
Eastern part. Eddies E2-E5. In the altimetry field these eddies look like cyclones with surface elevation below zero. It's clearly seen that all of these eddies have a low salinity in their centers. Note, that sections CC, DD, and EE cross approximately center of the eddies. Center of E2 eddy is located between sections AA and BB, closer to BB. Drop in salinity varies between 0.4-0.6 ppm. Temperature measurements indicate more uniform values, although in center of E2 and E4 eddies temperature lowered by 0.6 OC. As to SLA, seem like just one single point a day is too coarse sampling interval to resolve a details of the eddy evolution but it is enough to see the tendency. Eddy E1. In the altimetry field this eddy looks like anticyclone, or a "warm" eddy. Section AA crosses this eddy a bit west of its center and surface elevation is positive. Both, temperature and salinity show some changes in they values in that place but it's hard to interpret them as some kind of manifestation of anticyclone. Western part. Eddies E7-E8. In the altimetry field these
features look like cyclones with a surface elevation below zero. Section
GG crosses eddy E8 through its center so that a dramatic drop in salinity
is clearly seen on both sides of that section. Changes in temperature are
much more modest but are still evident.
In summary, note a common feature in eddies explored: fresh and cold water in the top layer over cyclonic structures. |
|
back to top |
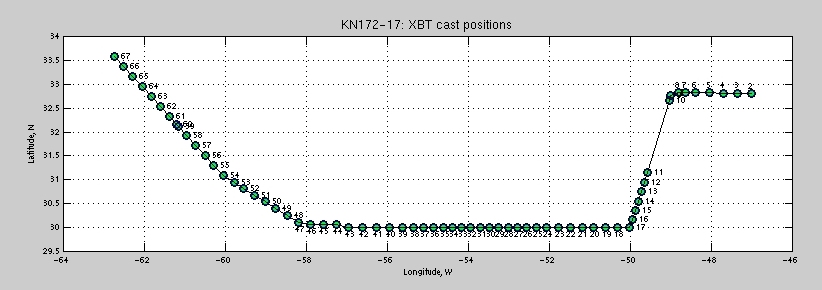
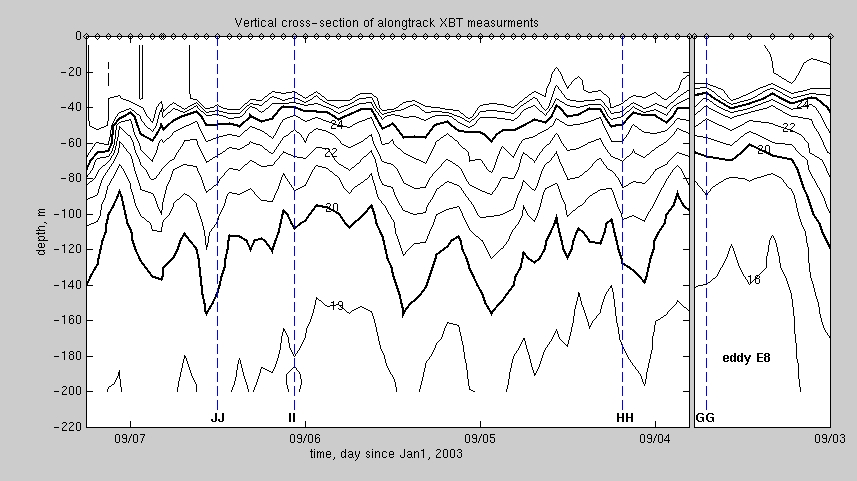
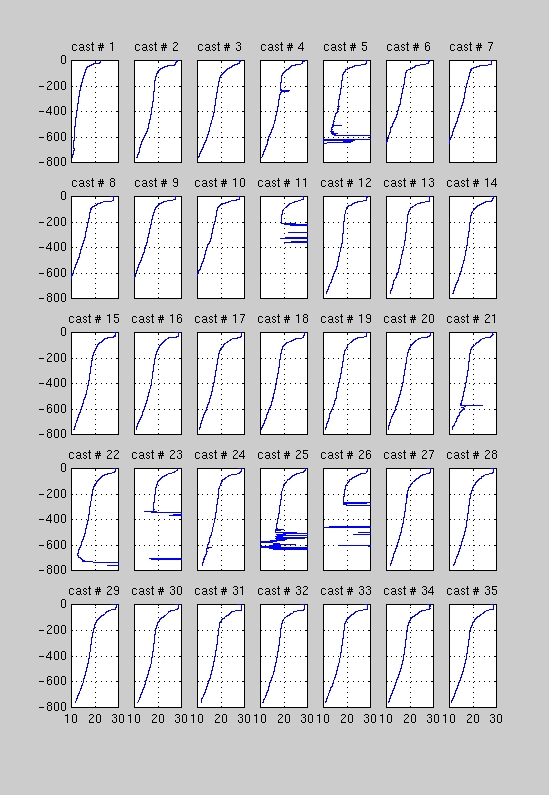
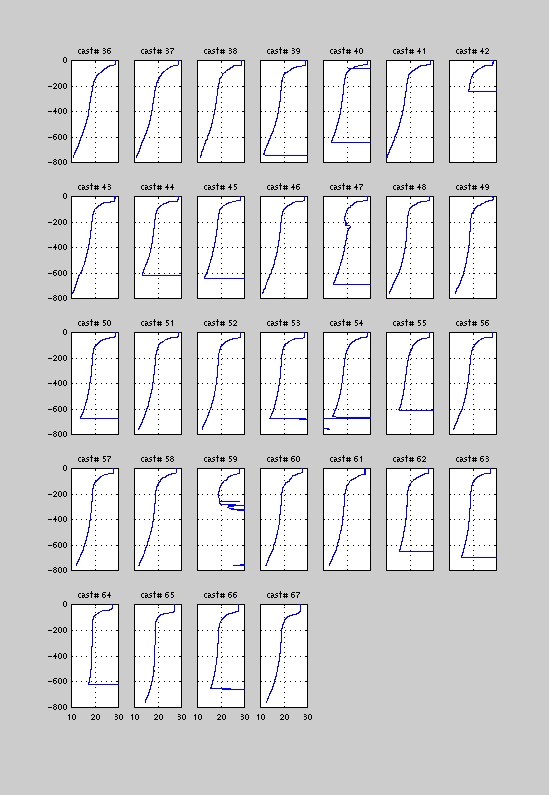
| XBT
There were 67 XBTcasts during
a cruise, locations of these casts displayed in figure below. Station #
1 was the test station performed in the Mediterranian, so it was excluded
from the further analysis.
|
| Click here to see the color plot. |
|
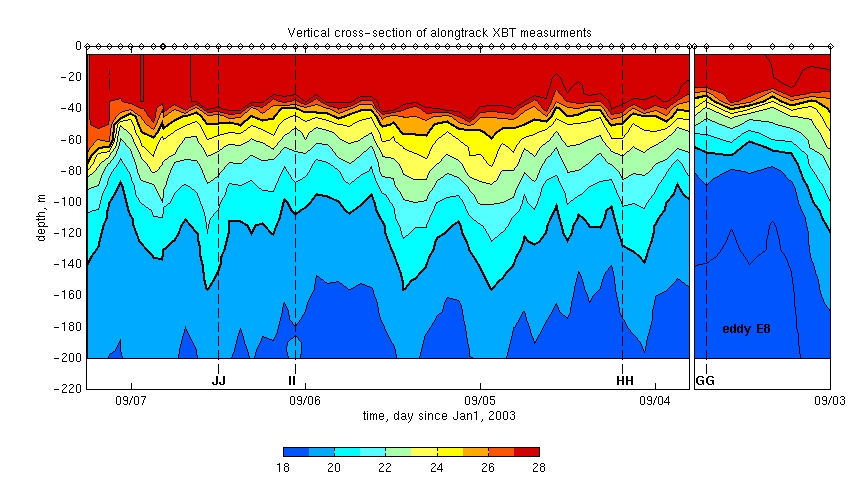
To extent a vertical section to a deep water, some processing has been applied. First of all, all "bad" data has been excluded using a very simple criteria: beginning from the surface the only monotonical part of the temperature profile was used. The rest of the profile (nonmonotonic part) was cutted off. After that, to fill in gaps, a cubic 2D interpolation was applied. Then, interpolated temperature field was subsampled to get that field with 5 m spacing in vertical. Corresponding contour plot displayed below. 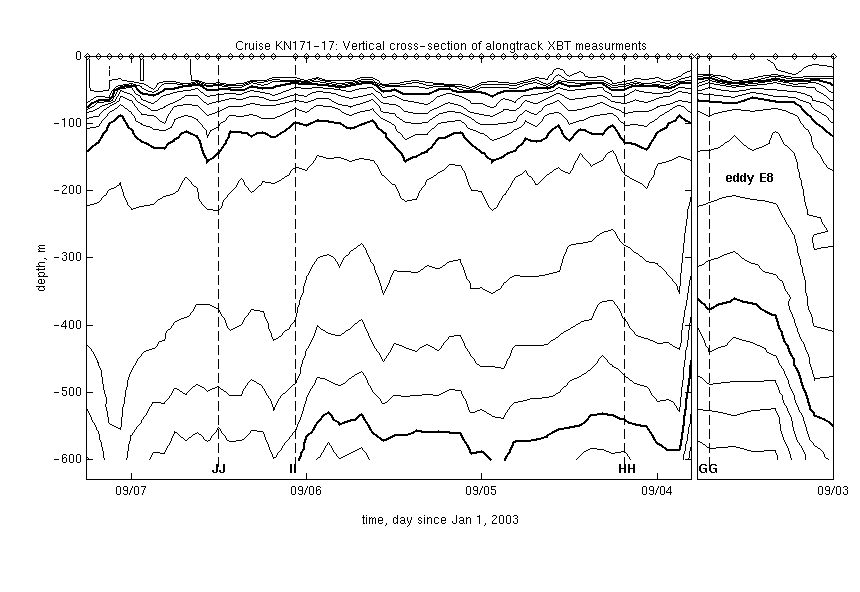 |
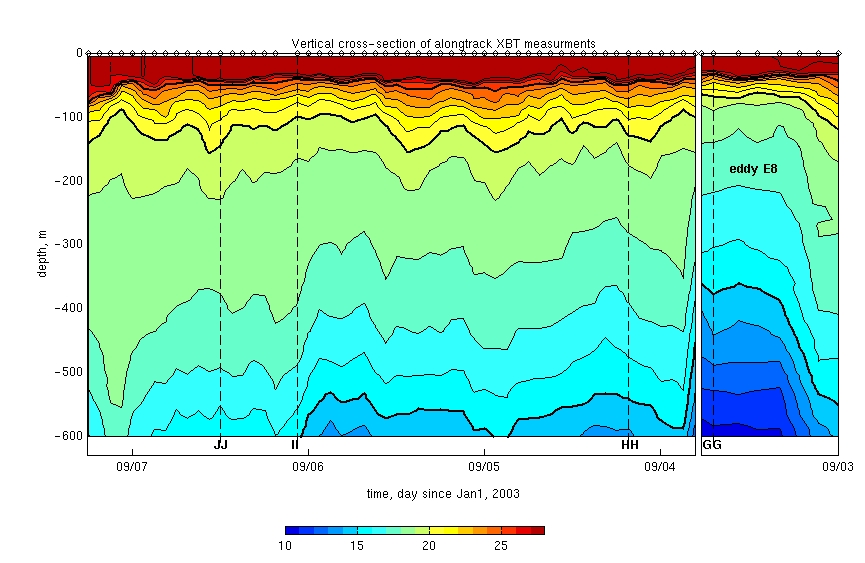
| Click here
to see the color plot.
In general features this plot is very similar to that of 0-200 m, except one thing. Cold feature visible west of the JJ section on 0-200 m plot, looks like isoterms were domed. On 0-600m plot this feature definitely looks like mid-water eddy: below "18 degree" layer isoterms go down, above this layer isoterms are domed. |
|
Back to top |
|
Correlation coefficient |
||
| Section AA-FF | Section FF-JJ | |
| SST vs SLA | 0.15 | 0.52 |
| Sal vs SLA | 0.46 | 0.56 |
| SST vs Sal | 0.63 | 0.40 |
| SST vs Wind Speed | -0.41 | -0.15 |
| SST vs Ta | 0.14 | 0.24 |
| Sal vs Ta | -0.12 | 0.00 |
| Sal vs Wind Speed | -0.17 | -0.06 |
| It worth to note a relatively high positive correlation between SLA and SST/Salinity which means that cold, fresh water corresponds to cyclonic eddies (lows in sea level), and warmer, salted water to anticyclonic eddies (highs in sea level). Also, there is a negative correlation between wind speed and SST: increasing/decreasing in wind speed causes deepening/shallowing of the mixed layer depth which leads to corresponding changes in SST. Positive correlation between SST and Salinity looks very natural: a physical reason which cause temperature/salinity changes is an eddy field. |
|
Back to top |